Microscopy Cell Imaging
Microscopes output crowded cell fields, so models split touching cells and count types to turn slides into dose ready numbers.
Why Does This Exist?
A pathologist counting 2,000 nuclei per slide tires by slide 20. Touching cells merge, stains vary by lab, focus drifts at edges. Microscopy vision exists to split, classify, and count: nuclei masks, cell types, mitosis flags, all with densities a doctor can trust.
Radiology differs. Medical image analysis reads organs at millimeter scale. Instance segmentation splits objects. This page is the slide stack: stain normalization, tiling, border aware splitting, and count calibration.
Basics first: whole slides are gigapixels, so models tile at 256 by 256 with overlap. Borders predict cell edges to split clumps. Counts sum over tiles with edge deduplication.
Think of It Like This
Counting grapes in bunches
Grapes touch and hide stems. You do not guess the bunch as one, you look for the thin gap lines and count crowns. Nuclei are grapes. Border maps are the gap lines. The analogy stops at color: grapes share hue, while cells vary by stain and need normalization first.
How It Actually Works
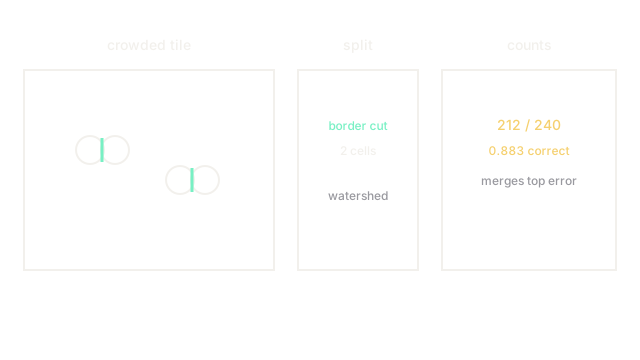
Stain vectors normalize each lab toward a reference. Tiles feed a U Net that outputs cell interiors plus borders. Watershed on borders splits clumps into instances. A classifier labels tumor, lymphocyte, and stroma. Mitosis gets a second high resolution pass. Counts divide by tissue area for density.
Focus and folds break the assumption. Blurry tiles inflate borders. Folded tissue looks dark and dense. Systems score focus and reject folds from counts, reporting usable tissue fraction.
Worked nuclei split
One region holds 240 true nuclei with 60 touching pairs. The model splits 212 correctly, merges 18 pairs into singles, and splits 10 singles into doubles. Correct rate is 212 divided by 240 which equals 0.883. Merges are 18 divided by 28 which equals 0.643 of errors, so border weight rises next run.
Watch Out For
Stain shifts that silently change counts
A new stainer darkens hematoxylin and the model overcalls nuclei by 15 percent. The symptom is stable accuracy on old lab with drift on new lab. Fix it with stain augmentation and per lab calibration slides.
The Quick Version
- Microscopy tiles gigapixel slides and splits touching nuclei by borders.
- Stain normalization precedes segmentation across labs.
- Our region split 212 of 240, rate 0.883.
- Merges dominate errors, so raise border loss next.
- Reject blurry and folded tissue from clinical counts.