Scaling Laws Vision Curves
Double data or weights and error falls by a steady fraction on a log plot. Straight lines plan budgets before big runs.
Why Does This Exist?
Big runs cost millions, so guessing size wastes budget. Scaling laws fit error for data plus similar terms for params and compute . Straight lines on log plots in foundation models planning pick the mix.
This page covers empirical curves only. Training recipes live in sibling pages.
The one idea you need first.
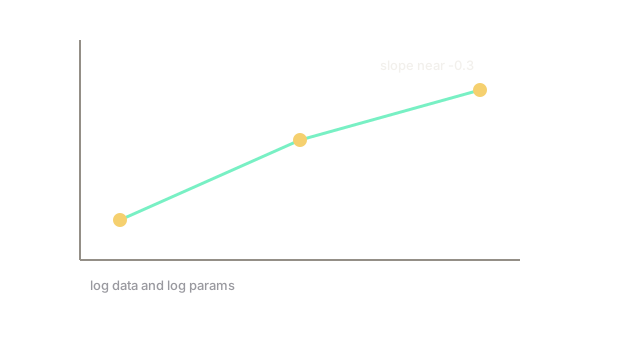
Power law means falls linearly in with slope near . Irreducible is the floor. Compute-optimal balances and together.
Think of It Like This
Farming yield versus seed plus water on log paper
Doubling seed lifts yield less each time, and doubling water does too. On log paper both trace straight lines, so a farmer splits coins between bags and pipes for top yield per coin.
Data is seed, params are water, and error is hunger. Where it stops: farms hit seasons, while models hit data quality walls.
How It Actually Works
Fit on small runs, then extrapolate. Repeat for at fixed . Pick minimizing under . Refit per task family since dense tasks slope less steeply than tags.
In plain words: sets level, sets slope, and sets the floor no scale beats.
Worked example
Errors percent at M, M, M photos. Ratios per x data. Slope here, milder than SOTA mixes. Next x to M predicts percent. Budgets follow the line, not hope.
Watch Out For
Extrapolating past data quality cliffs
Noisy web data breaks the line past some point and error stalls. Plans overshoot by x compute. Refit after cleaning and cap runs at the measured bend.
The Quick Version
- Vision error follows power laws in data, params, compute.
- Log plots turn curves into straight budget lines.
- Slope near 0.3 guides joint scaling.
- Floors from quality cap extrapolation.
- Refit per task family before big spends.