A/B Testing Models
How to route live traffic for model comparison. Canary deployment asks 'is the new model safe?' A/B testing models asks 'is the new model better?' The distinction matters because something can be safe — it doesn't crash, it's not slower — but still fail to move the metric you care about.
Why Does This Exist?
A canary deployment is about safety — you're checking that the new model doesn't break things. An A/B test is about improvement — you're asking whether the new model actually achieves a better outcome on the metric that matters to the business.
These are different questions, and they demand different experiment design. Safety checks can use engineering metrics (latency, error rate, eval score). A proper A/B test needs a business metric — click-through rate, session length, task completion rate, conversion — and it needs enough traffic and time to detect a real effect rather than noise.
Think of It Like This
Think of It Like This
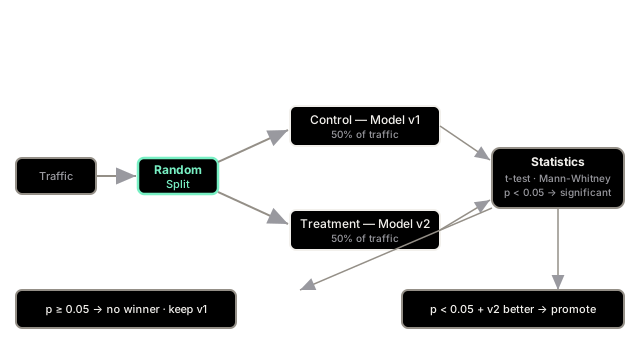
Two doctors want to test a new treatment. They don't give it to every patient and see what happens — that's a canary. They randomly assign half the patients to the new treatment and half to the current standard of care, then measure outcomes statistically. The random assignment is what makes the comparison causal: any difference in outcomes is due to the treatment, not some confounding factor like which patients happened to see which doctor.
What Makes It Different From Regular Canary Testing
The critical addition is randomisation and statistical testing.
In a canary, you often route based on a stable identifier (e.g., user ID ending in 0–4 gets the canary). This is convenient but not truly random — it can confound by user cohort characteristics. In a proper A/B test, assignment is random at each request, or truly random at the user level using a hash of the user ID and experiment ID.
The other addition is a statistical test on the result. If the A/B model shows a 2.3% improvement in task completion rate, you need to know whether that improvement would vanish if you ran the experiment again. A t-test or Mann-Whitney U-test with a significance threshold (typically p < 0.05) gives you that confidence.
Power Analysis: The Step Everyone Skips
Before launching an A/B test, calculate how much traffic you need to detect the effect size you care about. This is called a power analysis.
If your task completion rate is currently 45% and you want to detect a 2-percentage-point improvement (minimum detectable effect), with 80% power and 5% significance:
from scipy.stats import normimport numpy as np
def required_sample_size( baseline_rate: float, min_effect: float, alpha: float = 0.05, power: float = 0.80,) -> int: """Sample size per group for a two-proportion z-test.""" p1 = baseline_rate p2 = baseline_rate + min_effect p_bar = (p1 + p2) / 2
z_alpha = norm.ppf(1 - alpha / 2) # two-tailed z_beta = norm.ppf(power)
n = (z_alpha + z_beta) ** 2 * (p1 * (1 - p1) + p2 * (1 - p2)) / (p1 - p2) ** 2 return int(np.ceil(n))
n = required_sample_size(baseline_rate=0.45, min_effect=0.02)print(f"Minimum {n:,} users per group ({2*n:,} total)")# → Minimum 4,748 users per group (9,496 total)Without this calculation, you'll either end the test too early (false positive) or run it longer than necessary (wasted time and traffic on the canary).
Watch Out For
Peeking at the results and stopping early.
The single most common statistical error in online A/B tests is checking the results every day and stopping when p < 0.05 for the first time. This inflates the false positive rate dramatically — if you peek 10 times, your actual false positive rate is closer to 30%, not 5%. Either pre-commit to a sample size and don't look until you hit it, or use sequential testing methods (see sequential-testing) that are designed for continuous monitoring.
The Quick Version
- A/B testing asks whether the new model is better at the business metric, not just safe.
- Randomise assignment — confounded splits produce wrong conclusions.
- Run a power analysis before launching so you know how much traffic you need.
- Use a statistical test (t-test, Mann-Whitney) with p < 0.05 before declaring a winner.
- Never peek at results and stop early — it inflates false positive rates. Commit to the sample size upfront.