Correlation vs Causation
When two things move together, one might cause the other, or a hidden third factor might be driving both. ML optimizes correlation; intervention requires causation.
Why Does This Exist?
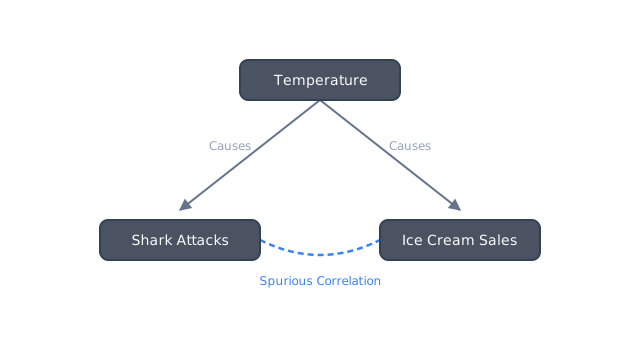
Machine learning models are fundamentally correlation engines. If you train a model to predict ice cream sales, and give it access to data on shark attacks, it will confidently learn that shark attacks are a strong positive predictor of ice cream sales. In a purely predictive setting—where you just want to know how much ice cream to stock—this is fine. The model is right: days with more shark attacks are indeed days with higher ice cream sales.
The problem starts when you want to act on the model's findings. If a business decides to reduce shark attacks (by banning swimming, for instance) in order to increase ice cream sales, the strategy will fail. The relationship was spurious, driven entirely by a hidden third factor: summer weather. People buy more ice cream when it's hot, and they swim more (leading to more shark attacks) when it's hot.
Causal inference exists because most business, medical, and policy decisions are interventions. We don't just want to predict the future; we want to change it. To do that, we have to isolate which variables actually drive the outcome, rather than just which variables happen to move alongside it in observational data.
Think of It Like This
Imagine you are looking at the dashboard of a car. You notice that every time the speedometer needle moves to the right, the car goes faster.
Think of It Like This
If you manually push the speedometer needle to the right with your finger, the car doesn't speed up. The needle is correlated with speed, but it doesn't cause the speed. Pressing the gas pedal causes the speed, which in turn causes the needle to move. Intervening on a symptom (the needle) never cures the disease.
This is the difference between seeing and doing. In probability terms, seeing is —the probability of given that we observe . Doing is —the probability of given that we physically force to happen. If is the speedometer needle and is the speed, is high, but is exactly zero.
How It Actually Works
The shift from correlation to causation is a shift from purely statistical models to structural models. In standard statistics, variables are just columns of numbers that co-vary. In causal inference, variables belong to a directed graph (a causal graph) where arrows represent the flow of physical or logical influence.
The Ladder of Causation
Judea Pearl formalized this distinction into a three-level hierarchy:
- Association (Seeing): What does a symptom tell me about a disease? This is standard machine learning. .
- Intervention (Doing): What if I take an aspirin? This requires us to understand how the system reacts to an external change. .
- Counterfactuals (Imagining): Was it the aspirin that cured my headache, or would it have gone away anyway? This requires us to imagine alternate histories for a specific individual. .
Spurious Correlations and Confounding
The most common reason correlation fails to imply causation is confounding. A confounder is a variable that causes both and .
If and , then and will be correlated in the data even if there is no arrow between them. If you train a regression model to predict using , it will assign a non-zero weight to . The model is biased because it cannot distinguish between the direct effect of on and the spurious path that flows backwards from up to and then down to .
To extract the true causal effect of on , we must block this spurious path. This is usually done by "controlling for" in our model (e.g., adding it as a feature in a regression, or matching samples that have identical values of ).
Code
Here is how a spurious correlation appears in a regression model, and how adding the confounder reveals the truth.
import numpy as npimport statsmodels.api as sm
# Set random seed for reproducibilitynp.random.seed(42)
# Generate a confounding variable: Temperaturetemperature = np.random.normal(25, 5, 1000)
# Shark attacks are caused by temperature, plus noiseshark_attacks = 0.5 * temperature + np.random.normal(0, 2, 1000)
# Ice cream sales are caused by temperature, plus noise# Notice: Ice cream sales are NOT caused by shark attacks!ice_cream_sales = 2.0 * temperature + np.random.normal(0, 3, 1000)
# 1. Naive Model: Predict ice cream sales using ONLY shark attacksX_naive = sm.add_constant(shark_attacks)model_naive = sm.OLS(ice_cream_sales, X_naive).fit()# -> The coefficient for shark attacks is ~4.0, highly significant.# -> The model strongly believes shark attacks drive sales.
# 2. Causal Model: Predict ice cream sales controlling for temperatureX_causal = sm.add_constant(np.column_stack((shark_attacks, temperature)))model_causal = sm.OLS(ice_cream_sales, X_causal).fit()# -> The coefficient for shark attacks is ~0.0.# -> The coefficient for temperature is ~2.0.# -> Controlling for the confounder eliminates the spurious correlation.Watch Out For
Controlling for everything.
A common mistake is throwing every available variable into the model to "control for confounding." This can actually induce spurious correlations if you accidentally control for a collider (a variable caused by both and ) or a mediator (a variable on the causal path between and ). Variable selection in causal inference must be driven by assumed causal structure, not feature importance.
Assuming more data solves confounding.
If your observational data is confounded by an unmeasured variable, scaling from ten thousand rows to ten billion rows does not fix the bias. It just makes the model's confident, incorrect estimate statistically significant. Big data cannot replace causal assumptions.
The Quick Version
- Correlation means two variables move together. Causation means manipulating one variable mechanically changes the other.
- Machine learning naturally optimizes for correlation, which is perfect for prediction but disastrous for intervention and decision-making.
- Spurious correlations are often driven by a confounder—a hidden third variable that causes both observed variables.
- To estimate a causal effect from observational data, you must understand the data-generating process and control for the right variables (while deliberately ignoring others).