Data Drift Detection
A model trained on last year's data meets this year's users. If the data coming in today looks different from what the model trained on, accuracy is going to drop — and data drift detection is the statistical radar that catches this shift before it becomes a crisis.
Why Does This Exist?
A model is a function fitted to data. When the data changes, the function can be wrong — but it will still return predictions, confidently. That's the danger. The model doesn't know that the world shifted; it just keeps applying the pattern it learned to data that no longer follows that pattern.
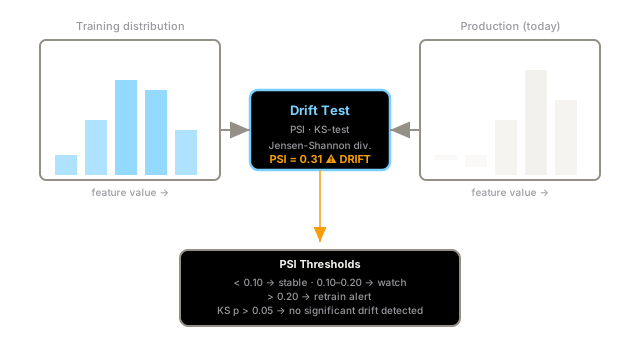
Data drift detection is the early warning system: compare what's coming in today against what the model trained on, statistically, and raise an alarm when the gap grows wide enough to plausibly hurt accuracy.
Think of It Like This
Think of It Like This
You trained a fraud detection model on last year's transaction data. The model learned that fraud tends to happen in small amounts, in foreign currencies, late at night. Then a new fraud scheme emerged that uses large domestic transactions in business hours. The model's inputs have drifted — the distribution of transaction amounts, currencies, and times no longer matches the training distribution. Without drift detection, you'd only notice when fraud rates climbed. With it, you'd see the feature distributions shift within days.
What Exactly Drifts
Covariate shift (input drift): the distribution of input features changes, but the relationship stays the same. The model might still work if you retrain it on the new distribution. Example: a recommender trained on desktop users gets deployed when half the users switch to mobile, shifting session length, scroll depth, and click pattern distributions.
Label shift (output drift): the prior distribution of labels changes. A fraud detector trained when 0.5% of transactions are fraudulent gets deployed during a fraud spike when 3% are. The model's predictions are biased toward "not fraud" because it never saw this base rate.
Concept drift is the related but distinct problem where the actual relationship changes — covered in concept-drift.
Statistical Tests for Drift
Population Stability Index (PSI) is the industry standard for tabular data. It compares two histograms bin-by-bin:
Interpretation is standardized: PSI < 0.10 means no significant drift; 0.10–0.20 means investigate; > 0.20 is a retrain alert.
Kolmogorov-Smirnov (KS) test compares the cumulative distribution functions of two samples. It's more sensitive than PSI for detecting small shifts in continuous distributions. A p-value > 0.05 suggests the two samples could plausibly come from the same distribution.
Jensen-Shannon divergence is bounded (0 to 1) and symmetric, making it convenient for high-cardinality categorical features where PSI's binning becomes unstable.
Code
import numpy as npfrom scipy import stats
def compute_psi(train_values: np.ndarray, prod_values: np.ndarray, bins: int = 10) -> float: """Population Stability Index. >0.20 = significant drift.""" # Bin edges from training distribution _, edges = np.histogram(train_values, bins=bins) edges[0] -= 1e-9 # include the left-most value edges[-1] += 1e-9 # include the right-most value
train_hist, _ = np.histogram(train_values, bins=edges) prod_hist, _ = np.histogram(prod_values, bins=edges)
# Convert to proportions, clip to avoid log(0) train_pct = np.clip(train_hist / len(train_values), 1e-9, None) prod_pct = np.clip(prod_hist / len(prod_values), 1e-9, None)
psi = np.sum((prod_pct - train_pct) * np.log(prod_pct / train_pct)) return float(psi)
def ks_drift(train_values: np.ndarray, prod_values: np.ndarray) -> tuple[float, float]: """Returns (statistic, p-value). p > 0.05 = no significant drift.""" statistic, p_value = stats.ks_2samp(train_values, prod_values) return statistic, p_value
# Example: check a feature named 'session_duration'train_data = np.load("train_session_duration.npy")prod_data = np.load("prod_session_duration_today.npy")
psi = compute_psi(train_data, prod_data)ks_stat, ks_p = ks_drift(train_data, prod_data)
print(f"PSI: {psi:.3f} — {'DRIFT' if psi > 0.20 else 'stable'}")print(f"KS p-value: {ks_p:.4f} — {'drift detected' if ks_p < 0.05 else 'stable'}")Watch Out For
Drifting the drift detector itself.
If you update your feature engineering pipeline — adding a new feature, changing a normalization scheme — your PSI will spike even though model accuracy is fine. The detector sees the engineered distribution change, not the underlying data change. Always re-baseline your drift detectors after any pipeline change. A stale baseline leads to either false alarms (if the new distribution is legitimately different) or missed drift (if you compensate by widening thresholds).
The Quick Version
- Data drift means the distribution of inputs in production no longer matches what the model trained on.
- Two types: covariate shift (inputs move, relationship stays) and label shift (label priors move).
- PSI is the standard test for tabular features: < 0.10 stable, > 0.20 retrain.
- KS test is more sensitive for detecting small shifts in continuous distributions.
- Re-baseline drift detectors after any feature engineering change — the detector is only as good as its reference distribution.