Model Monitoring
Deploying a model is the beginning of the work, not the end. Model monitoring watches the metrics that warn you something is going wrong — before accuracy drops, before costs spike, before users leave.
Why Does This Exist?
ML models don't fail the way software fails. A web server either returns 200 or it crashes. A model might return a 200 with a confidently wrong answer, and do so for three weeks before anyone notices. By then, the business impact is significant and the root cause is buried under weeks of changes.
The key insight behind model monitoring is that you can't always measure accuracy in production — you rarely have ground truth labels in real time. But you can measure proxies: output quality scores, refusal rates, response length distributions, and input feature distributions. These proxies often degrade before accuracy does, giving you time to intervene.
Think of It Like This
Think of It Like This
A hospital monitors patients' vital signs — heart rate, blood pressure, oxygen saturation — not because these are the things that kill people, but because they drop before the patient deteriorates. A nurse can intervene at 90% oxygen saturation; by the time the patient is unresponsive, the intervention options are much worse. Model monitoring is vital-sign monitoring for your ML system.
Four Families of Metrics
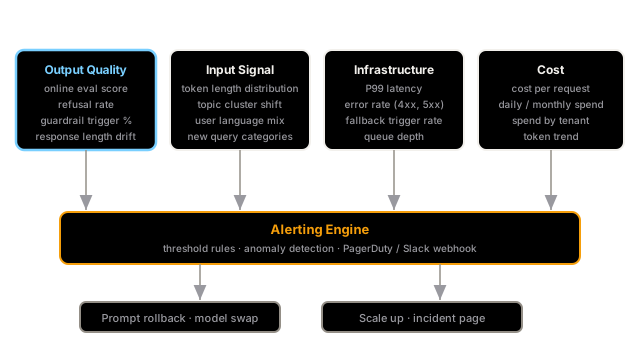
Output quality is the most important and the hardest to measure. Combine online evaluation scores (from an LLM judge), refusal rates (how often the model says "I can't help with that"), guardrail trigger rates, and response length distributions. Any of these shifting significantly over 24–48 hours is worth investigating.
Input signal catches changes in what users are asking. If the average query length doubles overnight, something changed — a viral moment, a new feature that attracts a different user type, or a bot attack. Track token length distributions, the topic clusters of incoming queries (using embeddings), and the fraction of queries in languages your model handles poorly.
Infrastructure metrics are the fastest to detect and act on. P99 latency, error rates by type (4xx vs 5xx), fallback trigger rates (a rising fallback rate means the primary model is degrading), and queue depth. These integrate directly with existing DevOps alerting tools.
Cost is a monitoring category that teams often add only after a surprise billing shock. Track cost per request by model and by endpoint, total daily and monthly spend, and spend by tenant. A cost spike that precedes an accuracy spike tells you something changed in your token usage — often a prompt regression that added 500 tokens to every request.
Setting Alert Thresholds
The mistake teams make is copying thresholds from other systems. Your model's refusal rate baseline might be 2% — setting a threshold at 5% is wrong if 2% is normal. Establish your baseline by monitoring for two weeks before setting thresholds.
Two types of alerts:
- Static threshold: "Alert if P99 latency exceeds 3,000ms." Good for hard constraints like SLAs.
- Relative threshold: "Alert if refusal rate increases by more than 30% relative to the 7-day rolling average." Good for metrics where the absolute value varies with traffic patterns.
Watch Out For
Alert fatigue from too many thresholds.
Engineering teams that monitor 50 metrics eventually monitor zero of them — everything becomes background noise. Start with five metrics: online eval score, refusal rate, P99 latency, error rate, and daily cost. Get alerts working for those, tune the thresholds until they fire only when something real is wrong, then add more. A monitor nobody trusts is worse than no monitor.
The Quick Version
- Models fail silently. Monitoring is how you find out before users do.
- Four metric families: output quality, input signal, infrastructure, and cost. Start with one from each.
- Establish baselines before setting thresholds — copy-pasted thresholds cause alert fatigue.
- Prefer relative thresholds (30% change from rolling average) for quality metrics; static thresholds for SLA commitments.
- Five metrics that monitor themselves well are more valuable than 50 that nobody looks at.