Regression Metrics
Each metric is a claim about which mistakes cost most: MAE says a miss is a miss, RMSE says the worst day owns the score, R-squared says nothing on its own.
Why Does This Exist?
A depot ships pallets of bottled water. Most days it's 400 to 600. One heatwave day it was 3,100; one public holiday it was 4, because the place opened for an hour.
Two forecasting models. Model A wins on RMSE, model B wins on MAE, and somebody has to ship one. No tie-breaker hides in the data — the metrics disagree because they price mistakes differently, and choosing is a decision about what a bad day costs the business.
Which makes the formulas the least interesting part. What matters is where each one lies to you. Throughout, an error is signed: prediction minus actual, in pallets, so positive means over-prediction.
Think of It Like This
Two ways to write a speeding fine
Schedule A charges £2 for every km/h over the limit. Sixty drivers each 1 km/h over brings in £120. One driver 60 km/h over also brings in £120. The schedule can't tell those apart, and isn't trying: it prices total drift.
Schedule B charges £2 per km/h over, squared. The sixty mild offenders still pay £120 between them. The one driver 60 over now pays £7,200, and every enforcement decision under B is about finding that car.
Neither is wrong. They're different claims about what causes harm on a road. MAE is schedule A, RMSE is schedule B, and picking one means making that claim about your own problem, noticed or not.
How It Actually Works
is day 's error and the number of days. Both land in pallets, so both read sensibly beside a real quantity.
Where the two part company
Twenty-one days. Twenty off by exactly 30 pallets, the holiday off by 300 because the model never learned the calendar.
MAE comes out at 42.9, RMSE at 71.7. Delete that one day and both become exactly 30.0 — identical, because equal errors give the squaring nothing to amplify.
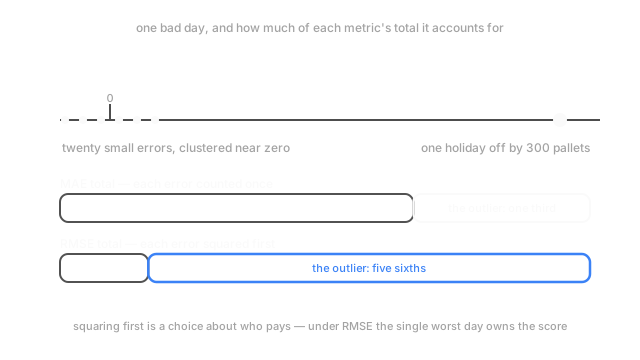
Look at what each total is made of. Of the 900 pallets of absolute error, the holiday contributes 300: one third. Of the 108,000 squared pallets, it contributes 90,000: five sixths. That's the picture above, and the whole difference between the two.
Which you want depends on the cost curve you face. If a 300-pallet miss costs ten times a 30-pallet miss, MAE is telling the truth. If it costs a hundred times — emergency lorries, a supermarket chain noticing — RMSE is. And if that 300 came from a logging error you can't remove, RMSE has quietly started reporting your data pipeline instead of your model.
MAPE divides by the actual
MAPE averages each error as a fraction of that day's actual, , times 100.
Across the twenty normal days that's about 6%. Add the holiday — 300 pallets off a true 4 — and that day alone scores 7,500%, hauling the average to 362.9%.
A subtler problem survives even without near-zero days. Under-predicting can be wrong by at most 100%: predict zero against a true 4 and you're 100% off. Over-predicting has no ceiling — predict 100 against a true 4 and you're 2,400% off. So MAPE charges over-forecasting harder, and anything tuned on it drifts low. On the twenty clean days here the constant minimising MAPE is 499 pallets; the one minimising MAE is 508. Nine pallets of pessimism, from the metric.
R-squared is a ratio, and the denominator moves
The numerator is your model's squared error; the denominator is the squared error of predicting the average every day. So answers one question: how much better than that average are you? Zero is "no better", one is perfect.
Three consequences get missed. A training never falls when you add a feature, so it's evidence of nothing. It's unreadable without the baseline, because the denominator is the baseline. And it goes negative on held-out data the moment the model loses to that average — a flat 700 across these days scores , which is real information.
So: report MAE by default, since it's the units the business already uses. Add RMSE when large misses cost disproportionately, and say which you optimised. Skip MAPE unless every actual sits well away from zero. And always put a baseline's score beside your model's. A model that beats nothing isn't a result.
Code
Four scorings of the same twenty-one days: the model, an always-predict-the-mean baseline, a flat 700, and the model with the holiday removed.
import numpy as np
def report(y: np.ndarray, p: np.ndarray) -> str: e = p - y mape = float(np.mean(np.abs(e) / np.abs(y)) * 100) # one near-zero actual owns this average r2 = 1.0 - float(np.sum(e ** 2) / np.sum((y - y.mean()) ** 2)) # baseline: always guess the mean return f"MAE {np.abs(e).mean():5.1f} RMSE {np.sqrt((e ** 2).mean()):5.1f} MAPE {mape:7.1f}% R2 {r2:6.2f}"
rng = np.random.default_rng(11)y = rng.integers(400, 600, 21).astype(float)y[20] = 4.0 # public holiday: the depot opened for one hourpred = y + rng.choice([-30.0, 30.0], 21) # twenty days off by exactly 30 palletspred[20] = 304.0 # the holiday it never learned, off by 300print("forecast ", report(y, pred))print("always-mean", report(y, np.full(21, y.mean())))print("flat 700 ", report(y, np.full(21, 700.0)))print("no holiday ", report(y[:20], pred[:20]))# -> forecast MAE 42.9 RMSE 71.7 MAPE 362.9% R2 0.65# -> always-mean MAE 76.8 RMSE 120.8 MAPE 573.0% R2 0.00# -> flat 700 MAE 223.7 RMSE 254.2 MAPE 868.7% R2 -3.43# -> no holiday MAE 30.0 RMSE 30.0 MAPE 6.1% R2 0.75Look at the last two rows: the same model on the same twenty days reads 0.65 with the holiday in the denominator and 0.75 without it.
Watch Out For
MAPE on a target that gets anywhere near zero
The symptom is a dashboard reading 362% and someone asking whether the model is broken. It isn't. One day had a true value of 4, the model said 304, and dividing by 4 gave 7,500% for that row. The mean of twenty small percentages and one enormous one is the enormous one with extra steps.
No threshold saves this. Use MAE, which stays in pallets and calls that day a 300-pallet miss, which it was. If a relative number is genuinely needed — comparing depots of different sizes — divide total absolute error by total actual across all days, which no single row can dominate. And drop closed days deliberately, not as outliers.
Comparing R-squared across two datasets or two different splits
Depot A scores 0.91, depot B scores 0.62, and the write-up concludes the model works better at A. But A serves a coastal town with wild seasonal swings, so its actuals vary enormously and its denominator is huge. B is steady. The model may be more accurate at B in pallets, and can't tell you: the denominator changed underneath the comparison.
Compare MAE or RMSE in units when the datasets differ, and keep inside one fixed dataset. For a cross-depot number, divide each model's error by the same baseline's error at that depot — like-for-like improvement instead of two ratios with different denominators.
The Quick Version
- MAE is the mean absolute error, in the target's units. A 10-unit miss counts ten times a 1-unit miss — usually what people mean by "how far off are we".
- RMSE squares first, so your worst prediction dominates. Right when large misses cost disproportionately, wrong when the data carries outliers you can't remove.
- MAPE divides by the actual, so it explodes near zero and punishes over-prediction harder, which drifts anything tuned on it low.
- is the fraction of variance explained: it never falls when you add a training feature, means nothing without a baseline, and can go negative on held-out data — which says the mean would have won.
- Report MAE by default, add RMSE when big misses cost extra, and never publish a score without a baseline's score beside it.