Sequential Testing
Standard A/B testing forbids you from peeking at the results before the test ends. Sequential testing changes the math so you can look at the data every single day and stop early without ruining the validity of the test.
Why Does This Exist?
The golden rule of traditional A/B testing is no peeking. You must calculate your required sample size in advance, run the test for exactly that duration, and only check the p-value at the very end.
If you peek at the results every day and stop the test the moment the p-value drops below 0.05, you will massively inflate your False Positive Rate (Type I error). A test designed to have a 5% false positive rate might actually have a 30% false positive rate if you peek daily, because random noise will almost always briefly dip the p-value below 0.05 at some point during the run.
But in industry, waiting two weeks for a test that is obviously winning (or obviously destroying revenue) is painful. Sequential Testing exists to solve this. It is a family of statistical methods that adjust the math so you can legitimately peek at the data continuously, allowing you to stop successful experiments early and kill bad ones immediately.
Think of It Like This
Think of It Like This
Traditional A/B testing is like baking a cake. You must set the timer for 30 minutes, close the oven door, and you are absolutely forbidden from opening the door until the timer rings. If you open it early, the cake collapses (your statistics become invalid).
Sequential testing is like cooking a soup on the stove. You are allowed to taste the soup continuously. As soon as it tastes perfect, you can turn off the stove and serve it immediately.
How It Actually Works
Sequential testing abandons the fixed-sample-size assumption of classical frequentist statistics (like the standard t-test) and uses dynamic boundaries or entirely different probability frameworks.
Always-Valid P-Values
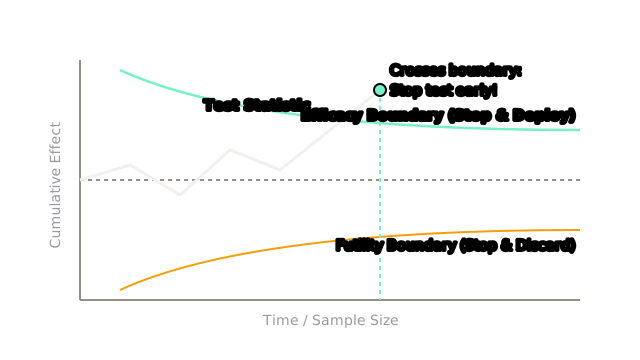
The most common modern approach uses Always-Valid P-Values (often built on mixture martingales). Instead of a static threshold (like 0.05), the boundary for significance changes as more data comes in.
- At 1,000 users, the evidence required to stop the test is massive.
- At 100,000 users, the evidence required is much smaller.
This dynamic boundary guarantees that no matter how many times you peek, your overall False Positive Rate over the lifetime of the experiment will never exceed your target (e.g., ).
The Sequential Probability Ratio Test (SPRT)
Developed by Abraham Wald during World War II for quality control, SPRT keeps a running tally of the log-likelihood ratio between two hypotheses. Instead of waiting for samples, it updates a score after every single observation. The test has two thresholds: an upper boundary (Accept Treatment) and a lower boundary (Reject Treatment). The test continues until the score crosses one of the boundaries. It is mathematically guaranteed to reach a decision faster, on average, than a fixed-horizon test.
Code
This code demonstrates the "Peeking Problem" with a standard t-test, showing how continuous monitoring creates false positives even when the models are identical (no real lift).
import numpy as npimport scipy.stats as statsimport matplotlib.pyplot as plt
np.random.seed(42)days = 14users_per_day = 1000
# True Conversion Rates are IDENTICAL (5.0%). The new model does nothing.true_c = 0.050true_t = 0.050
cumulative_control = []cumulative_treatment = []p_values = []
# Simulate the test running for 14 daysfor day in range(1, days + 1): # Daily new traffic daily_control = np.random.binomial(1, true_c, users_per_day) daily_treatment = np.random.binomial(1, true_t, users_per_day) cumulative_control.extend(daily_control) cumulative_treatment.extend(daily_treatment) # We "Peek" every day by running a t-test on the cumulative data t_stat, p_val = stats.ttest_ind(cumulative_treatment, cumulative_control) p_values.append(p_val) if p_val < 0.05: print(f"Day {day}: p={p_val:.3f}. FALSE POSITIVE! The test 'won' due to noise.") # If we didn't know better, we would stop the test here and deploy.
# Look at the final day's result (The only valid time to check in traditional A/B testing)print(f"Final Day p-value: {p_values[-1]:.3f}. (Correctly not significant).")If you run a simulation like this 1,000 times, you will find that continuous peeking causes the test to falsely declare a winner roughly 20-30% of the time, instead of the promised 5%. Sequential testing adjusts the 0.05 threshold dynamically so this inflation doesn't happen.
Watch Out For
Delayed Conversions.
Sequential testing assumes the outcome happens immediately. If your primary metric is "7-day retention" or "Subscription after 30-day trial", sequential testing cannot speed up the test. You still have to wait 30 days to observe the outcome of the users who arrived on day one.
Day-of-Week Effects.
Even if your sequential test says you won on Tuesday (Day 3), you shouldn't stop. User behavior on weekends is often fundamentally different from weekdays. If you stop early, your new model might only be good at predicting Tuesday behavior. It is best practice to mandate a minimum duration of one full week (7 days) or two full weeks, even when using sequential methods.
The Quick Version
- The Peeking Problem: Checking a standard A/B test daily and stopping early inflates your false positive rate, causing you to deploy models that don't actually work.
- Sequential Testing mathematically corrects for continuous monitoring.
- It uses dynamic decision boundaries (like Always-Valid P-Values or SPRT) that allow you to stop the test early if the effect is massive, without increasing your error rate.
- It is the standard evaluation method for modern experimentation platforms at companies like Netflix, Uber, and Optimizely.