Slice-Based Evaluation
A single aggregate metric hides critical failures; slice-based evaluation reveals them by partitioning the dataset into distinct cohorts and scoring each independently.
Why Does This Exist?
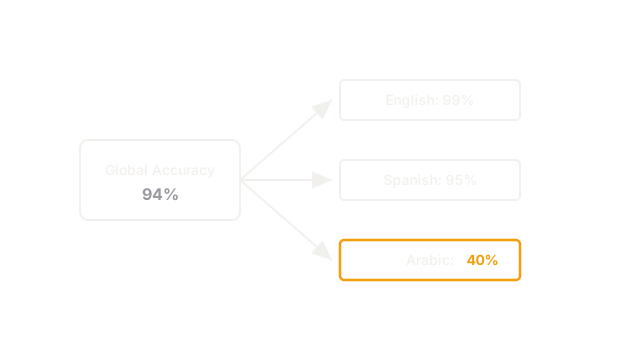
When you evaluate a machine learning model, you typically calculate an aggregate metric over your entire test set, such as "94% global accuracy." For a business stakeholder, this sounds phenomenal. For an engineer, this number is a trap.
The problem with a global average is that it is dominated by the most common examples in your dataset. If 90% of your users speak English and your model correctly handles 99% of their queries, the model will look highly performant overall. However, if the remaining 10% of your users speak Arabic, and the model completely fails on their queries (e.g., 40% accuracy), the global average will still sit comfortably above 90%.
You have built a model that is "94% accurate and utterly useless for an entire demographic." Slice-based evaluation exists to prevent this. Instead of settling for a single number, you partition your evaluation dataset into meaningful slices (e.g., language, device type, account age, or text length) and hold each slice to its own performance bar. It is the only way to prove that a model works for everyone, not just the majority group.
Think of It Like This
Think of slice-based evaluation like grading a restaurant.
If a restaurant serves 1,000 customers a day, and 900 of them order a hamburger while 100 order a vegan salad, a global "customer satisfaction score" of 95% might sound great.
But if you look closer and slice the data by order type, you might discover that hamburger eaters rate the restaurant 100%, while vegan customers rate it 50% because their salads are consistently wilted. The 95% average hid the fact that the restaurant is systematically failing a specific cohort of customers.
How It Actually Works
Implementing slice-based evaluation requires shifting from a monolithic testing approach to a partitioned one. This is typically implemented inside an automated evaluation harness and relies on rich metadata.
1. Defining the Slices
A slice is simply a subset of your dataset defined by a specific condition. Slices usually fall into three categories:
- Demographic / Fairness Slices: Cohorts defined by protected attributes like age, race, gender, or spoken language. This is where slice-based evaluation bridges directly into fairness and AI ethics.
- Behavioral Slices: Cohorts defined by user interaction. For example, "users who joined in the last 7 days," "mobile vs. desktop users," or "queries longer than 50 words."
- Known Failure Modes: Cohorts created based on previous rounds of error analysis. If you know your model struggles with sarcastic text, you tag sarcastic examples as a specific slice so you can track improvements on that exact weakness over time.
2. Tagging the Dataset
For slice-based evaluation to work, your dataset cannot just be raw (input, target) pairs. Every example must be enriched with metadata tags. This is often the hardest part of the process, as it requires either manual human annotation (e.g., humans explicitly tagging "sarcasm") or automated heuristics (e.g., a script that calculates text length and assigns a length_bucket tag).
3. Independent Scoring
During the evaluation run, the harness computes the aggregate metrics as usual. However, it then groups the predictions by the metadata tags and recalculates the metrics for each group.
A strict production pipeline will define a Service Level Agreement (SLA) not just for the global metric, but for the slices. For instance, a model deployment might be blocked if global accuracy drops below 90%, or if the accuracy on the "Arabic language" slice drops below 85%.
Code
Here is how you might calculate slice-based metrics using a Pandas DataFrame containing predictions, targets, and metadata.
import pandas as pdfrom sklearn.metrics import accuracy_score
def evaluate_by_slice( df: pd.DataFrame, slice_column: str) -> pd.DataFrame: """ Computes accuracy for the global dataset and for each cohort defined by the slice_column. """ results = [] # 1. Global Metric global_acc = accuracy_score(df['target'], df['prediction']) results.append({"Slice": "GLOBAL", "Accuracy": global_acc, "N": len(df)}) # 2. Slice Metrics for slice_value, group_df in df.groupby(slice_column): slice_acc = accuracy_score(group_df['target'], group_df['prediction']) results.append({ "Slice": f"{slice_column}={slice_value}", "Accuracy": slice_acc, "N": len(group_df) }) return pd.DataFrame(results)
# df contains a 'language' column:# -> evaluate_by_slice(df, 'language')# Slice Accuracy N# 0 GLOBAL 0.941 10000# 1 language=en 0.992 8500# 2 language=es 0.950 1000# 3 language=ar 0.400 500Watch Out For
The Small-N Problem
When you slice a dataset, the number of examples in each cohort shrinks. If your rare slice only contains 12 examples, a single incorrect prediction drops the accuracy by over 8%. This introduces massive statistical variance. Never trust a slice-based metric without also looking at the sample size (N) for that slice. If a slice is too small, you cannot evaluate it; you must invest in collecting more data for that specific cohort.
Simpson's Paradox
It is mathematically possible for a model to improve its global accuracy while simultaneously getting worse on every individual slice, provided the distribution of the underlying data shifts between the slices. This is why tracking slices is not a luxury—it is the only way to guarantee that a new model is genuinely better across the board.
The Quick Version
- Global evaluation metrics are easily dominated by the majority class, masking severe failures in minority cohorts.
- Slice-based evaluation partitions the dataset using metadata tags (e.g., language, device, or difficulty) and scores each group independently.
- It is a foundational technique for ensuring AI fairness, as it prevents a model from failing on protected demographic groups while maintaining a high overall score.
- Implementing it requires a dataset rich in metadata and a testing harness capable of grouped metric aggregations.
- Always check the sample size of a slice; metrics on tiny cohorts are statistically meaningless.