Manifolds
A manifold is a curved space that looks flat when you zoom in close, letting constrained models like rotations use local coordinates safely.
Why Does This Exist?
Orthogonal matrices, unit vectors, and low-rank factors all obey constraints that flat gradient steps violate: add two rotation matrices and the result is not a rotation. Projecting back after each step works but fights the geometry instead of using it.
Manifolds name these spaces properly so calculus adapts to them. Once a constraint set is a manifold, tangents, retractions, and Riemannian gradients follow. Sequel pages: tangent spaces, optimization on manifolds.
The one idea you need first
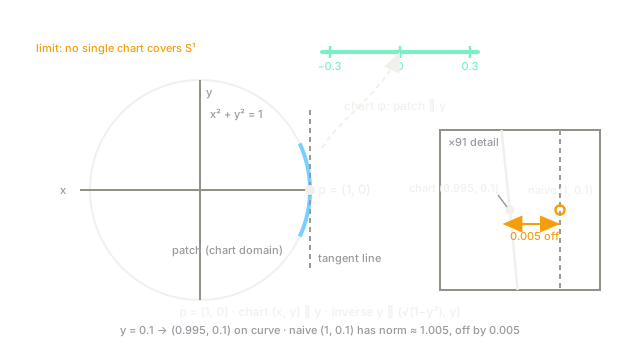
A chart is a local coordinate map from a patch of the manifold to flat . An atlas of overlapping charts covers the whole space with smooth transitions. The circle needs at least two charts because no single interval wraps it without a seam.
Think of It Like This
Atlases for a round planet
No single paper map shows Earth without tearing or warping. An atlas uses many overlapping pages, each accurate locally, with conversion rules where pages overlap.
Manifolds work the same way. Each chart is one reliable page. The transition maps are the margin notes saying how pages glue together. Algorithms live inside one page at a time and convert when crossing edges.
Where the analogy stops: mathematical charts need smooth overlap to carry derivatives across, not just matching coastlines.
How It Actually Works
An -dimensional manifold gives every point a neighborhood diffeomorphic to . Dimension is intrinsic: the circle is 1D (one angle locally) despite sitting in 2D. Key ML examples: sphere (unit vectors), rotations (3D manifold in 9D matrices), Stiefel (orthonormal frames), Grassmann (subspaces).
Worked example
Unit circle at :
- Upper-half chart: fails at (vertical tangent), so use the right-half chart with inverse .
- At , . Move : point becomes . Constraint holds exactly.
- Naive Euclidean step has norm . Off the manifold by . Chart coordinates keep you on it; raw addition does not.
Watch Out For
Using one global coordinate system on a curved space
Euler angles cover rotations but hit gimbal lock: a degree of freedom vanishes at the poles and gradients blow up. Single-chart thinking causes singularities.
Use quaternions, rotation matrices with projection, or chart-switching instead of one angle triple everywhere.
Projecting after huge Euclidean steps
Tiny steps plus projection approximate manifold motion well. Giant steps leave the neighborhood where the projection is sensible and snap to distant points.
Keep steps within the chart radius or use retractions designed for the manifold.
The Quick Version
- Manifolds are locally flat, globally curved spaces with chart atlases.
- Dimension is intrinsic: the circle is 1D despite living in 2D.
- Rotations, spheres, and orthonormal frames are the core ML manifolds.
- Chart coordinates respect constraints that raw addition violates.
- One global coordinate choice invites singularities like gimbal lock.