Visualizing Data using t-SNE
Introduced t-SNE, a highly effective dimensionality reduction technique that revolutionized the visualization of high-dimensional datasets.
Paper: Visualizing Data using t-SNE
Authors: Laurens van der Maaten, Geoffrey Hinton · 2008
Read the paper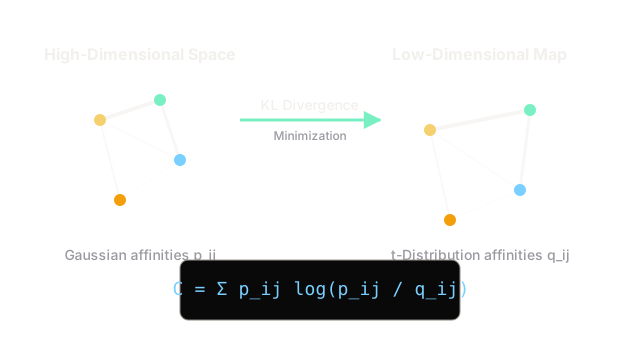
The Problem
Visualizing high-dimensional data (like images, text embeddings, or genetic sequences) on a 2D or 3D plot is crucial for human interpretation. However, traditional linear methods like Principal Component Analysis (PCA) struggle to preserve complex, non-linear local structures—often overlapping distinct clusters. Existing non-linear methods, such as SNE (Stochastic Neighbor Embedding), suffered from the "crowding problem," where points that are somewhat distant in high dimensions get crushed together in the center of the low-dimensional map, obscuring natural clusters.
The Idea
The authors proposed t-Distributed Stochastic Neighbor Embedding (t-SNE). They modified the original SNE algorithm by changing how distances in the low-dimensional space are modeled. Instead of using a Gaussian distribution for the low-dimensional map, they used a Student's t-distribution (specifically, a Cauchy distribution with one degree of freedom). This heavy-tailed distribution allows moderately distant points in the high-dimensional space to be mapped much further apart in the low-dimensional space, effectively solving the crowding problem.
How It Works
t-SNE works by matching probability distributions between high and low dimensions.
- High-Dimensional Probabilities: It first computes the probability that two points are neighbors in the high-dimensional space based on their Gaussian-scaled Euclidean distance. Points that are close have a high probability; points that are far have a near-zero probability.
- Low-Dimensional Probabilities: It then calculates similar probabilities for the points in the target 2D or 3D space, but uses the heavy-tailed t-distribution instead of a Gaussian.
- Optimization: The algorithm iteratively moves the points in the low-dimensional space to minimize the Kullback-Leibler (KL) divergence between the high-dimensional and low-dimensional probability distributions, using gradient descent. This pulls similar points together and strongly pushes dissimilar points apart.
Why It Mattered
t-SNE became the gold standard for visualizing high-dimensional datasets in machine learning and data science. Its unprecedented ability to unspool complex data manifolds into visually distinct, interpretable clusters allowed researchers to easily inspect their datasets, debug neural network embeddings, and discover meaningful subclassifications in fields ranging from computer vision to single-cell genomics.
What Came After
While t-SNE is ubiquitous, it is computationally expensive for massive datasets and doesn't explicitly preserve global data structure well. This led to the development of UMAP (Uniform Manifold Approximation and Projection) in 2018, which builds on similar principles but is much faster and often better at preserving global topology, though t-SNE remains widely used and foundational to data exploration.