Metrics Monitoring System
AdvancedOverview
A Metrics Monitoring System (like Datadog, Prometheus, or New Relic) aggregates time-series data from thousands of servers, microservices, and databases in real time. It allows engineers to visualize system health on dashboards and configure alerts when metrics cross defined thresholds.
Functional Requirements
- Ingest metrics from millions of endpoints in real time (e.g., CPU, memory, request counts).
- Store time-series data efficiently for short-term (high resolution) and long-term (downsampled).
- Provide a querying interface for dashboards to fetch and aggregate data quickly.
- Evaluate alerting rules in real time and trigger notifications (email, PagerDuty, Slack).
Non-Functional Requirements
- High availability: The monitoring system must be up even when the monitored systems are failing.
- High write throughput: The system is extremely write-heavy (millions of data points per second).
- Low read latency: Dashboards should load quickly, and alerts should fire within seconds of a threshold breach.
- Scalability: Must easily scale as the number of monitored services grows.
Capacity Estimation
Assume 10 million distinct metrics reported every 10 seconds.
- QPS: 10,000,000 / 10 = 1,000,000 writes/sec.
- Storage: A single data point (timestamp, value, tags) can be compressed to ~2 bytes using Gorilla compression.
- Per day: 1M * 86,400 * 2 bytes = ~172 GB/day.
- Over 1 year (with downsampling policies): ~10-20 TB.
- Bandwidth: Write ingress ~2 MB/s (highly compressible). Read egress depends on dashboard usage, generally much lower than ingress.
High-Level Architecture
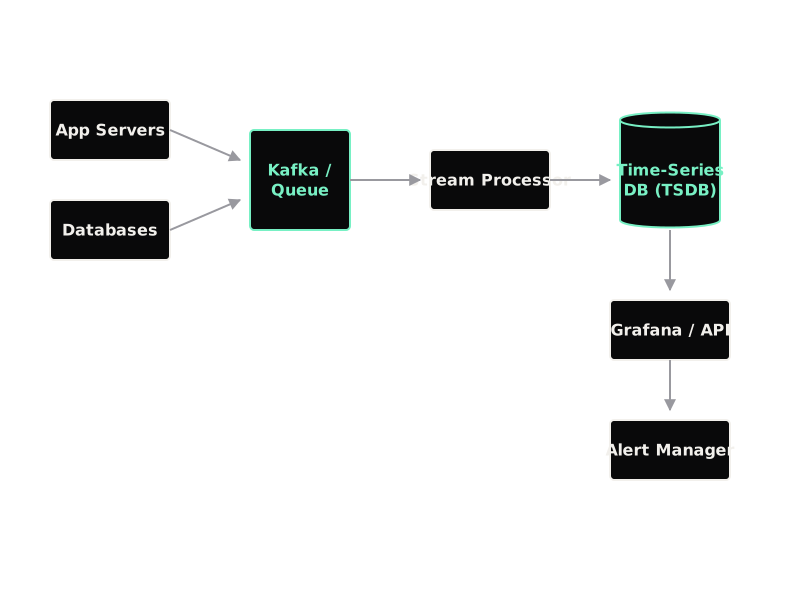
The architecture relies on an agent-based or pull-based model to gather metrics. Data flows into a high-throughput message queue (Kafka) to buffer spikes. Stream processors (like Flink or Spark) pull from Kafka to evaluate real-time alerts and downsample data before writing it to a Time-Series Database (TSDB). A Query Service reads from the TSDB to serve dashboards and ad-hoc queries.
Data Model
| Entity | Fields / Schema | Storage Choice |
|---|---|---|
| data_point | metric_name, tags (key-value pairs), timestamp, value | Time-Series Database (e.g., InfluxDB, Prometheus TSDB, or Cassandra-based) |
| alert_rule | id, metric_pattern, threshold, duration, notification_channel | Relational store |
Detailed Design
Push vs Pull Model
Pull (Prometheus style): The monitoring server scrapes metrics from registered endpoints. Easier to avoid overwhelming the server, but requires service discovery.
Push (Datadog style): Agents installed on servers push metrics to the monitoring backend via UDP or TCP. Requires load balancers and queues to handle traffic spikes.
Time-Series Database (TSDB)
Relational databases are too slow for this write-heavy workload. A TSDB uses a Log-Structured Merge (LSM) tree optimized for appending data based on time. Data points are compressed in memory (using techniques like Delta-of-Delta encoding for timestamps and XOR for floating-point values) before being flushed to disk in chunks.
Alerting Engine
Alerts cannot wait for data to hit the database and be queried later. Instead, Stream Processors evaluate incoming data points in memory against active alert rules in a sliding time window. If a threshold is breached (e.g., "CPU > 90% for 5 mins"), it sends an event to the Alert Manager, which handles deduplication, grouping, and routing to third-party integrations.
Bottlenecks & Solutions
High Cardinality: If users add unique tags like user_id or request_id to metrics, the number of distinct time series explodes, causing massive memory pressure on the TSDB index. Solution: Limit cardinality on tags, pre-aggregate data, and enforce strict rate limits on unique tag combinations.
Storage Costs: Storing high-resolution data forever is cost-prohibitive. Solution: Implement a rollover/downsampling strategy. Keep 10-second resolution for 7 days, 1-minute resolution for 30 days, and 1-hour resolution for a year.