Distributed Tracing
On this page
Overview
In a microservices architecture, a single user request might traverse dozens of different services. Distributed tracing is the method of tracking that request's path and timing as it hops from service to service, allowing engineers to pinpoint exactly where latency or errors are occurring.
Key Concepts
Traces and Spans
- Trace: The complete journey of a single request through the entire system. It is a collection of spans.
- Span: A single unit of work within that journey (e.g., "Database Query", "API call to Auth Service"). A span has a start time, end time, and metadata.
Correlation IDs
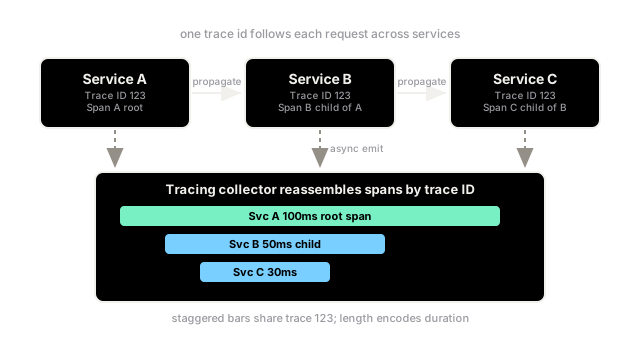
To make this work, the very first service that receives the request (often the API Gateway) generates a unique Trace ID (or Correlation ID). This ID is then injected into the HTTP headers of every subsequent downstream request. Each service reads the Trace ID, does its work (creating a Span), and passes the ID along. The spans are asynchronously sent to a tracing backend (like Jaeger or Zipkin), which stitches them together based on the Trace ID into a visual waterfall graph.
Context Propagation
The act of passing the Trace ID along is called Context Propagation. Modern systems use standardized formats like W3C Trace Context (which uses the traceparent HTTP header) to ensure that even if Service A is written in Java and Service B is written in Node.js, they can pass the trace data seamlessly.
Trade-offs
The primary tradeoff is data volume and cost. If a system handles 10,000 requests per second, and each request generates 10 spans, storing 100,000 spans a second is prohibitively expensive. The solution is Sampling. Instead of recording everything, the system might record 1% of all requests, or use "tail-based sampling" to record 100% of requests that result in an error or take longer than 2 seconds, while ignoring the normal, healthy traffic.
Interview Tips
- When asked how to debug a slow request in a microservices architecture, "Distributed Tracing via Correlation IDs" is the exact phrase the interviewer is looking for.
- Explain that you would visualize the trace in a tool like Jaeger to see a waterfall graph, immediately highlighting the slow dependency.
- Mention sampling as a way to control the massive storage costs associated with tracing.
Summary
- Distributed tracing tracks a single request as it crosses multiple microservices.
- A Trace represents the whole journey; a Span represents one step of the journey.
- A Correlation ID (Trace ID) is generated at the entry point and passed in HTTP headers.
- The data is visualized as a waterfall graph to quickly identify latency bottlenecks.
- Sampling is used to reduce the massive data volume by only saving a percentage of traces.