OpenTelemetry (OTel)
Overview
OpenTelemetry (OTel) is an open-source, vendor-neutral standard for instrumenting, generating, collecting, and exporting telemetry data (Metrics, Logs, and Traces) to help analyze software performance and behavior.
Key Concepts
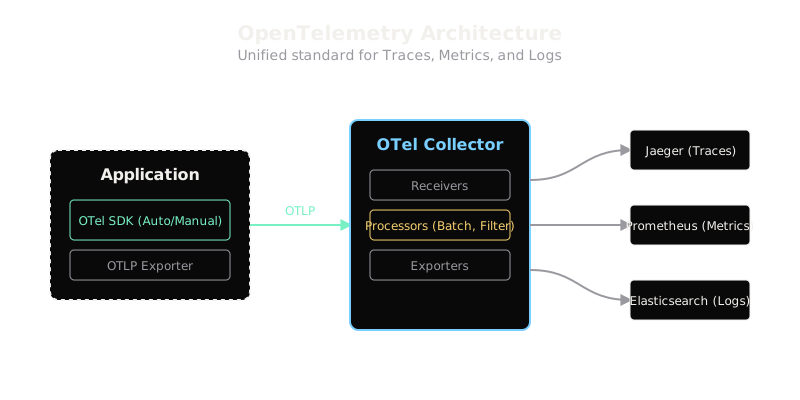
Historically, observability was deeply fragmented. You used one SDK for Prometheus (metrics), another for Jaeger (tracing), and a log shipper for Elasticsearch. If you changed vendors, you had to rewrite your application code. OTel solves this via three main components:
1. OpenTelemetry SDKs (Instrumentation)
OTel provides libraries for most major languages. They offer Auto-instrumentation (automatically wrapping HTTP frameworks, database drivers, etc. to emit traces and metrics without code changes) and Manual instrumentation (APIs for custom business metrics and trace spans).
2. OTLP (OpenTelemetry Protocol)
The standard protocol (usually over gRPC or HTTP) used to transmit telemetry data from the application to the collector, or directly to a backend.
3. The OpenTelemetry Collector
A vendor-agnostic proxy that sits between your applications and your observability backends. It functions as a pipeline with three stages:
- Receivers: Accept data in various formats (OTLP, Prometheus, Jaeger, Zipkin).
- Processors: Modify the data in transit. Common uses include batching data for efficiency, filtering out PII (Personally Identifiable Information), or sampling traces (e.g., only keeping 1% of successful traces but 100% of errors).
- Exporters: Send the processed data to one or more backend destinations (Datadog, AWS X-Ray, Prometheus, Elasticsearch).
Trade-offs
The primary advantage of OTel is vendor lock-in prevention. You can switch from a self-hosted Prometheus stack to a managed Datadog stack just by changing a few lines in the Collector's YAML configuration, with zero changes to your application code. The trade-off is architectural complexity: running and scaling a fleet of OTel Collectors adds operational overhead. Furthermore, while tracing and metrics standards in OTel are highly mature, the logging specification has historically lagged slightly behind, though it is rapidly stabilizing.
Interview Tips
- When designing an observability pipeline, explicitly mention placing an OTel Collector as a sidecar or a dedicated gateway to decouple the app from the backend vendor.
- If asked how to handle massive tracing volume, explain Tail-based Sampling at the Collector level (buffering traces and only keeping those that resulted in an error or high latency).
- Use OTel to demonstrate modern, cloud-native architectural thinking.
Summary
- OpenTelemetry (OTel) is the industry standard for telemetry data (Traces, Metrics, Logs).
- It prevents vendor lock-in by decoupling instrumentation from the storage backend.
- Auto-instrumentation can monitor standard libraries without code changes.
- The OTLP protocol standardizes how telemetry is transmitted.
- The OTel Collector receives, processes (batches/filters/samples), and exports data to various backends.