Visual explainer
Confusion Matrix
The 2x2 table behind every classification metric, worked with 40, 10, 20 and 30 calls.
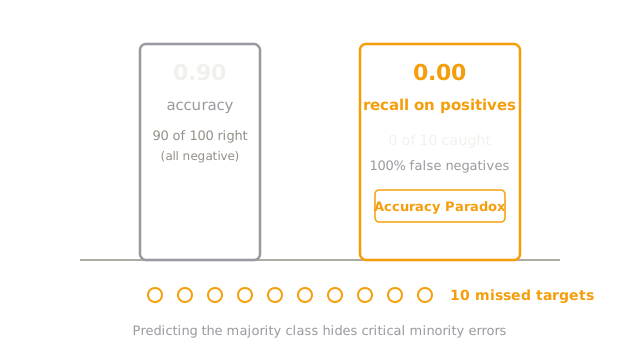
Evaluating classifiers with a single aggregate metric creates dangerous blind spots. On an imbalanced dataset containing negative cases and rare positive targets, a dummy model predicting "negative" for every sample achieves a seemingly impressive () accuracy. Yet its recall on the target class is exactly —it catches zero of ten critical events. Evaluating performance requires inspecting the underlying distribution of decisions.
Rows Predict, Columns Confirm
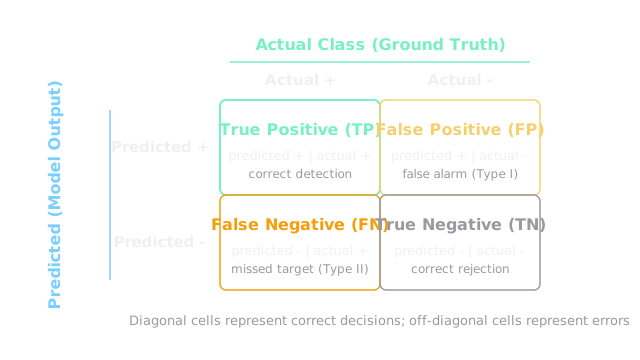
The confusion matrix organizes every classification decision into a two-dimensional grid: rows indicate model predictions while columns represent ground truth:
- True Positive (TP): Predicted positive and actually positive (correct alarm).
- False Positive (FP): Predicted positive but actually negative (Type I error / false alarm).
- False Negative (FN): Predicted negative but actually positive (Type II error / missed target).
- True Negative (TN): Predicted negative and actually negative (correct rejection).
Diagonal cells capture correct decisions; off-diagonal cells isolate distinct failure modes.
Four Buckets, One Hundred
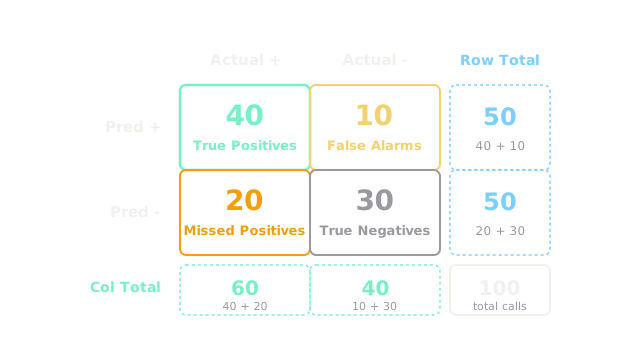
Evaluating predictions against ground truth produces four distinct counts:
Marginal sums verify total consistency:
- Predicted rows: positive calls, and negative calls.
- Actual columns: actual positives, and actual negatives.
- Grand total: .
Overall accuracy is .
Precision Splits From Recall
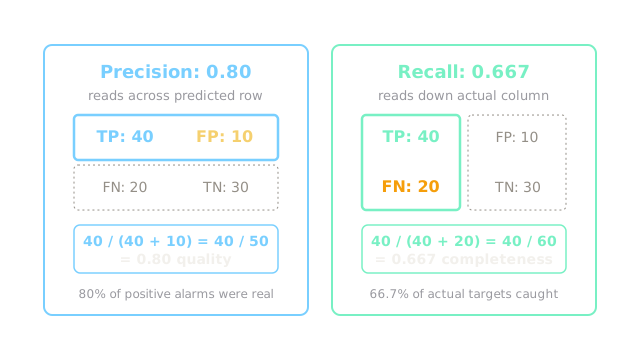
Precision and recall evaluate the same true positives against different reference totals:
Precision reads across the predicted row to measure alarm reliability: of declared positives were genuine. Recall reads down the ground-truth column to measure completeness: the model discovered of all real targets in the population.
F1 Leans Low
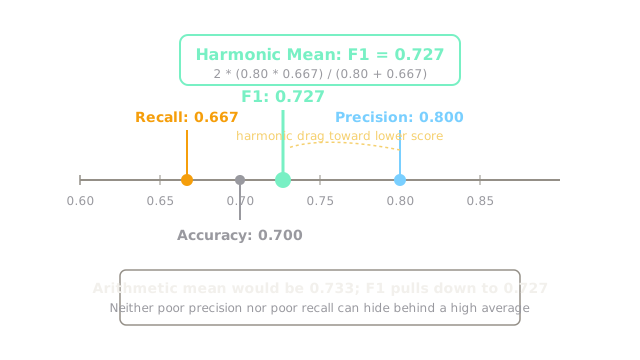
Combining precision and recall requires the harmonic mean (-score), which penalizes uneven performance:
An arithmetic average would yield . The harmonic formulation pulls the blended score down toward the lagging metric (), ensuring that neither high precision nor high recall can artificially inflate overall performance.
Match Costlier Error
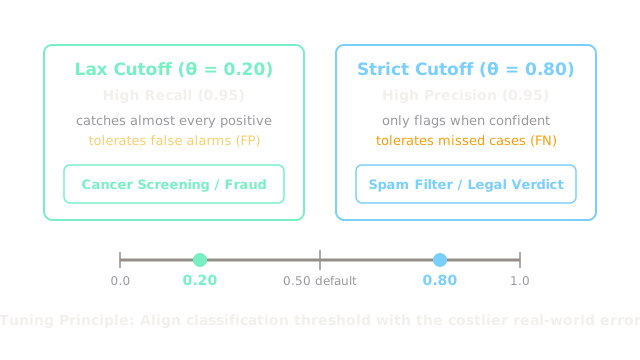
Operating a probabilistic classifier requires choosing a decision cutoff . Adjusting trades false alarms against missed detections:
- Lax threshold (): Maximizes recall () by declaring positives aggressively. Essential in cancer screening and fraud prevention, where a false negative is catastrophic.
- Strict threshold (): Maximizes precision () by demanding strong certainty before firing. Essential in spam filtering and automated trading, where false alarms carry severe operational costs.
Threshold selection must be calibrated to the real-world asymmetric cost of each error type.
Where It Breaks
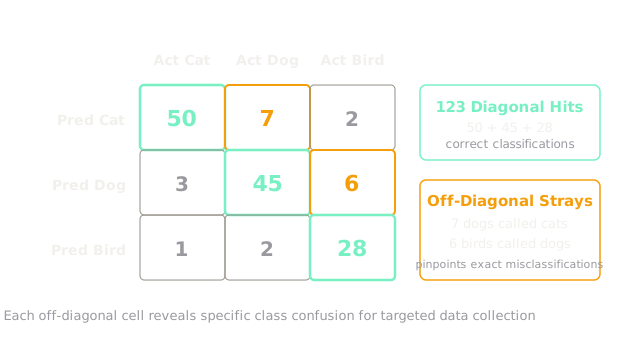
Expanding to classes produces a matrix with diagonal elements and off-diagonal error cells. Across three classes (Cat, Dog, Bird):
- Diagonal entries capture correct classifications.
- Six off-diagonal cells pinpoint exact pairwise confusion: dogs were misclassified as cats, while birds were misclassified as dogs.
Rather than retraining indiscriminately, inspecting specific off-diagonal cells directs targeted feature engineering and data collection to resolve specific confusion pairs.
The Quick Version
- Accuracy of 0.90 masks complete failure when minority classes are ignored.
- Predicted labels form rows; actual ground-truth classes form columns.
- The 100-sample fixture splits into 40 TP, 10 FP, 20 FN, and 30 TN.
- Precision (row read) reaches 0.80; recall (column read) reaches 0.667.
- Harmonic F1 sits at 0.727, pulling downward toward the lower recall value.
- Adjust the decision threshold to penalize whichever error carries the higher cost.
- Off-diagonal cells in multi-class matrices identify exact pairwise failure patterns.