Individual Vs Group Fairness
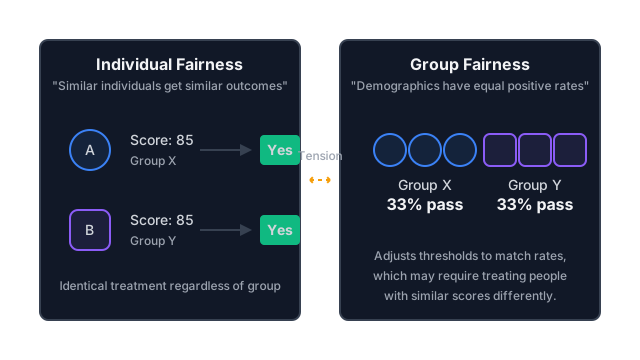
Similar people should get similar decisions, and groups should get equal rates. Those two ideas clash when base rates differ, so every team ends up picking one.
Why Does This Exist?
Early teams tried the obvious fix: delete gender and race from the data and call the model fair. It failed twice. First, the model rebuilt the missing columns from stand-ins like zip code, school, and vocabulary, so blindness changed nothing. Second, even a genuinely blind model can land unevenly when groups start from different places, because the same rule applied to different distributions produces different rates.
Researchers then wrote down what fairness could mean, and two families emerged. Individual fairness says similar people get similar outcomes. Group fairness says groups get equal rates. Each sounds undeniable on its own. Together they contradict each other whenever the groups differ, which is nearly always, and that contradiction is mathematical rather than a matter of opinion.
This page teaches both definitions, the exact point where they collide, and how to choose. For the parent tour of metrics, read AI fairness first. For the legal yardstick that measures outcome gaps, disparate impact is next. For catching violations before launch, model auditing closes the loop.
Think of It Like This
One admissions rubric versus a balanced class
A selective university tries two ideas of fair. First it grades every applicant on one rubric: two files scoring 88 get the same decision no matter who they belong to. That is individual fairness, and it feels clean until someone notes one applicant had private tutoring and a quiet study while the other worked nights. Identical scores, very different roads.
So the university tries the second idea: the incoming class must mirror the applicant pool, with equal admit rates across backgrounds. To hit those rates it admits an 85 from an under-resourced school while waitlisting an 88 from a wealthy one. The class looks balanced, but two near-identical files got different answers, and the rejected 88 has a legitimate complaint too.
The mapping is direct. The rubric is the single threshold, the class composition is the selection rate, tutoring is the historical advantage baked into the scores, and the waitlisted 88 is the individual-fairness violation that group targets create.
Where it stops: a university chooses its class openly and defends the choice, while a model buries the same choice inside a threshold nobody reads. The analogy shows the tradeoff but not the opacity, which is why the decision must be written down and measured rather than left in the weights.
How It Actually Works
Write each applicant as features , with holding everything except the protected attribute, and write the model's decision as , which is 1 for admit and 0 for reject. Individual fairness constrains pairs. Group fairness constrains rates.
Individual fairness: similar in, similar out
Two people with distance between them must get decisions no further apart than times that distance:
In plain words: measures how alike two applicants are, is the model's output, and caps how fast the output may change as people differ. Nearly identical files must get nearly identical answers. The entire battle hides inside , because deciding which features count toward similarity is a judgment call. Include school quality and two applicants from different worlds look different; exclude it and they look the same. A flawed makes the model faithfully reproduce whoever defined similar.
Group fairness: equal rates across groups
Demographic parity ignores pairs and demands equal selection rates. With protected attribute marking the groups:
In plain words: the chance of admission must be the same in both groups. Stricter siblings split the rates further. Equalized odds demands equal true positive and false positive rates per group, so qualified applicants succeed equally often and unqualified ones fail equally often. The famous impossibility result says these group targets generally cannot all hold at once when base rates differ, which is the normal case, so teams pick the one matching the harm they most fear.
Worked example: one cutoff, two rates, no escape
Score twelve applicants. Group A scores and group B scores . Apply one shared cutoff at 80, the individual-fairness choice.
Group A passes one of six, the 84, for a rate of . Group B passes five of six, everything except the 68, for . The ratio of the lower rate to the higher is , far below the 0.8 four-fifths flag, so group fairness fails loudly. That is the top row of the diagram.
Now force parity at 3 of 6 each. Group A needs its cutoff at 70, passing 70, 76, and 84 for . Group B needs its cutoff at 93, passing 93, 97, and 102 for . Rates match, and individual fairness breaks on contact: an applicant scoring 76 passes as a member of A and fails as a member of B, and one scoring 82 does the reverse side of the same trick. Same score, different answer, with the protected attribute as the only difference. That pair is the amber callout in the bottom row. There is no third cutoff that fixes both rows, because the score distributions genuinely differ.
Code
Two threshold policies on the same twelve scores, in plain Python. One shared cutoff treats equal scores equally and splits the rates; per-group cutoffs equalize the rates and split equal scores.
scores_a: list[int] = [45, 55, 62, 70, 76, 84]scores_b: list[int] = [68, 82, 88, 93, 97, 102]
shared: int = 80pass_a: int = sum(1 for s in scores_a if s >= shared)pass_b: int = sum(1 for s in scores_b if s >= shared)print(f"{pass_a}/6 {pass_b}/6") # -> 1/6 5/6
cut_a: int = 70cut_b: int = 93par_a: int = sum(1 for s in scores_a if s >= cut_a)par_b: int = sum(1 for s in scores_b if s >= cut_b)print(f"{par_a}/6 {par_b}/6") # -> 3/6 3/6
split_76: tuple[int, int] = (1 if 76 >= cut_a else 0, 1 if 76 >= cut_b else 0)print(split_76) # -> (1, 0)The outputs match the hand counts: 1 of 6 against 5 of 6 under one cutoff, 3 and 3 under split cutoffs, and a score of 76 that passes in A and fails in B.
Watch Out For
Deleting the column and declaring victory
The team drops gender from the features and ships, confident the model is now blind. It is not. Zip code, first name patterns, employment gaps, and vocabulary reconstruct the missing column well enough that the gap barely moves.
Symptom: the feature list looks clean while selection rates by group stay split. Fix: never judge blindness by inputs. Judge it by outcomes, with disaggregated rates on held-out data, exactly as model auditing prescribes. If the rates split, the model sees group membership whether or not you handed it the column.
Enforcing the wrong equality for the stakes
Demographic parity in a medical screen forces equal flag rates across groups whose actual illness rates differ, which means over-testing one group or under-testing the other. Individual similarity in hiring freezes in historical advantage, because similarly qualified candidates from unequal backgrounds keep getting similarly unequal treatment dressed as neutrality.
Symptom: the metric is green and the harm continues. Fix: match the definition to the decision. Use equalized odds where mistakes have clinical costs, parity-style targets where the good itself is being shared out, and write down why in the release notes. Choosing the metric is policy, not plumbing.
The Quick Version
- Individual fairness gives similar people similar outcomes under one shared rule.
- Group fairness gives groups equal rates, most simply demographic parity at equal selection probabilities.
- One cutoff at 80 on our twelve scores passes 1 of 6 in group A and 5 of 6 in group B, a ratio of 0.20.
- Forcing 3 and 3 needs cutoffs at 70 and 93, so a score of 76 passes in one group and fails in the other.
- Deleting the protected column does not fix this, because stand-in features rebuild it.
- Pick the definition that matches the stakes and document the choice, since the math forbids satisfying all of them.