Model Auditing
Model auditing systematically measures a system's behaviour across diverse demographic subgroups and edge cases to detect hidden bias before deployment.
Why Does This Exist?
A hiring model posts 93 percent accuracy and ships. Months later someone slices the results and finds one demographic at 81 percent, wrongly rejected far more often than anyone else. The headline was true and useless at the same time. Averages do that: they let a large well-served group vouch for a small badly served one.
Model auditing exists to split the scoreboard before users pay the price. It is the formal gate between a trained model and a deployed one: define the harms, build data that can reveal them, measure every slice, probe the edges on purpose, and block launch when the gaps fail the bar. Regulation increasingly demands exactly this paper trail, but the practice predates the rules because teams kept learning the same lesson from incidents.
This page covers the audit sequence end to end. For the fairness definitions you will test against, read AI fairness and individual vs group fairness. For the adversarial sequel that attacks the model instead of measuring it, red teaming ethics is next. For reporting what you found, see transparency and accountability.
Think of It Like This
Crash testing with every body size
A carmaker tests a new model with one average-sized dummy in the driver seat. It scores five stars. Then a regulator demands dummies of all sizes in every seat, and the passenger-side airbag turns out to brutalize smaller occupants. The five stars were real for the dummy they used and fiction for everyone else.
An audit is that regulator. The overall accuracy is the five-star sticker. The subgroup slices are the dummies of all sizes: each demographic, each edge case, each seating position the designers forgot. Disaggregated testing is running every dummy. The launch gate is refusing showrooms until all of them walk away.
Where it stops: crash dummies feel physics that never changes, while model behaviour drifts with data, incentives, and adversaries. A car that passes stays passed. A model that passes in March needs retesting in September, which is why audits repeat instead of expiring.
How It Actually Works
An audit moves in five stages. Each stage has one job, and skipping any one of them is how biased models keep shipping with clean paperwork.
Scope the harms
Name what can go wrong before measuring anything. For a resume screener the harm is denying qualified candidates work; for a loan model it is overcharging one group; for a medical model it is missing illness in patients the training data underrepresents. Write each harm as a falsifiable claim, such as the false positive rate in group B exceeds the rate in group A by more than 10 points. If a harm cannot be stated that crisply, the team does not understand the product well enough to audit it yet.
Build the eval slice
The training distribution cannot grade itself. Assemble evaluation data with enough minority and edge-case examples to measure precisely, including the inputs the product team wishes did not exist: typos, dialects, dim photos, rare names. A slice of 30 examples cannot resolve a 5 point gap, so size each subgroup for the claim being tested. Label carefully with diverse annotators, because a biased label set makes the audit certify the bias.
Worked example: 930 of 1,000 hides 162 of 200
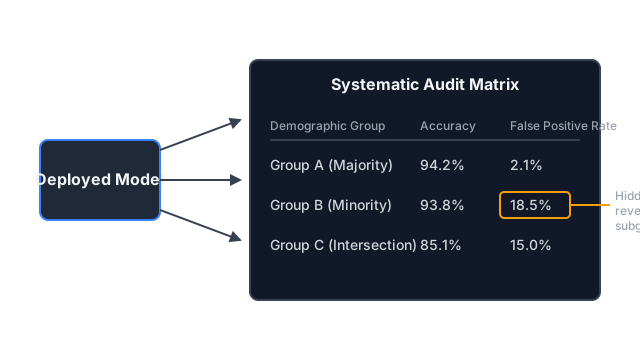
Evaluate 1,000 cases split into slices A (500), B (200), and C (300). The model gets 480 right in A, 162 in B, and 288 in C.
Slice accuracy is (96 percent) for A, (81 percent) for B, and (96 percent) for C. Overall is (93 percent). The B-to-A accuracy ratio is , about 0.84, which clears the 0.8 four-fifths flag, so a careless auditor stops here and ships.
The error types tell the real story. Suppose each slice has 100 negative cases and the model falsely flags 3 in A, 25 in B, and 10 in C. False positive rates are percent, percent, and percent. The B-to-A false positive ratio is , nowhere near 0.8. One group absorbs nearly all the false alarms while the headline reads 93. That pair of ratios, 0.84 on accuracy but 0.12 on false positives, is the diagram above, and it is why the audit measures error types per slice instead of one accuracy per model.
Probe and gate
Numbers alone miss what adversaries find. Flip pronouns, names, and dialects in otherwise identical inputs and watch for decision flips. Perturb images within realistic noise and check the verdict holds. Then write the report with the slices, the probes, the thresholds, and the verdict, and enforce it: fail means retrain, constrain, or refuse to deploy. Responsible AI frameworks turn this gate into a standing lifecycle habit.
Code
The four-fifths check in plain Python. It takes the favourable rate in each of two slices and returns the ratio plus whether it clears the 0.8 flag that auditors use as a first screen.
def four_fifths_flag(rate_low: float, rate_high: float) -> tuple[float, bool]: """Ratio of the lower rate to the higher rate, and whether it clears 0.8.""" ratio: float = min(rate_low, rate_high) / max(rate_low, rate_high) return (ratio, ratio >= 0.8)
print(four_fifths_flag(0.81, 0.96)) # -> (0.84375, True)print(four_fifths_flag(0.03, 0.25)) # -> (0.12, False)The outputs match the hand arithmetic: accuracy passes the screen at about 0.84 while the false positive comparison fails it at 0.12. A real gate runs this per metric, not per model, and treats any failure as a launch blocker until someone explains it in writing.
Watch Out For
Blindness claimed as proof
The model never sees the protected column, so the team files that fact as the audit. Stand-in features carry the same signal through zip codes, schools, and word choice, and the slices split anyway.
Symptom: clean feature lists next to split outcomes, with the blindness claim quoted in every review. Fix: audit outcomes, never inputs. If disaggregated error rates differ, the model knows group membership regardless of which columns you handed it, and the report must say so.
A toolkit run mistaken for an audit
Someone runs an open-source fairness package, pastes two charts into a document, and calls it an audit. Automated metrics can contradict each other, the eval slice may still mirror training, and no human has decided which metric matches the actual harm.
Symptom: green charts, no scope statement, no probes, no verdict with a name on it. Fix: require the human parts. Named harms up front, a sized eval slice, adversarial probes, and a signed gate decision. Tools compute; auditors judge.
The Quick Version
- Overall accuracy lets a large well-served slice vouch for a small badly served one.
- Our audit of 1,000 cases read 93 percent overall while slice B sat at 81 percent.
- Accuracy ratios can pass the 0.8 screen while false positive ratios fail it, 0.84 against 0.12 here.
- Audits scope harms, build sized eval slices, split every metric, probe adversarially, and gate launch.
- Blindness to protected attributes proves nothing; split outcomes are the verdict.
- A toolkit output without scoped harms and a signed decision is not an audit.