Lane Detection
Lane detection finds the painted lines and road edges that define where the car may drive, as curves in the image or the ground plane.
Why Does This Exist?
Planning needs the corridor, not just obstacles. Without lanes the car cannot center, change lanes legally, or judge curvature ahead. Painted lines are thin, broken, reflective, and often occluded, so naive edge finding shatters. Lane detection exists to turn fragile markings into stable geometry: which pixels belong to which line, fitted as a smooth curve that survives gaps and glare.
For area masks see semantic segmentation and for boxes see object detection.
Think of It Like This
Following a dashed center line in rain
You do not trust any single dash. You collect the visible dashes, ignore the puddle reflections, and imagine the smooth line they all agree on. The model does the same per image row, then fits one curve through the votes. The analogy stops at eyes: the model also uses learned priors about lane count and spacing.
How It Actually Works
Images map to lane instances. Common heads predict per-row line presence across column bins, or segment thin masks then cluster. A fitting step converts votes into polynomials or splines in image or bird's-eye coordinates. Inverse perspective mapping helps on flat roads by removing perspective convergence. Tracking across frames smooths flicker. Accuracy is judged by point-wise distance to labeled curves plus false-positive rate on crosswalks and tar seams.
Worked example
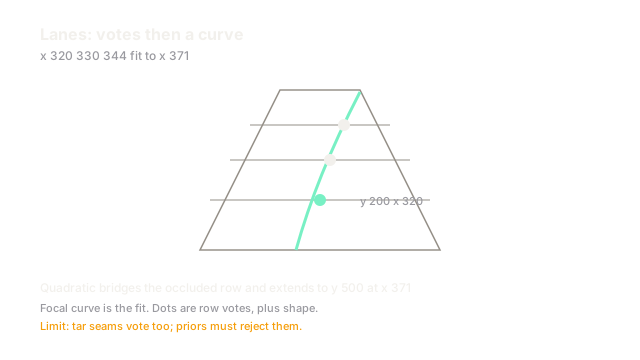
Take rows with winning columns . A quadratic through them solves to roughly , , . At the curve predicts , extending the lane past the last clear marking. If row 300 is occluded by a wiper, the fit still bridges the 100-pixel gap because two good rows constrain the curve.
Code
This snippet fits a quadratic through three lane points.
import numpy as np
def fit_lane(ys: np.ndarray, xs: np.ndarray) -> np.ndarray: A = np.stack([np.ones_like(ys), ys, ys**2], axis=1) coef, *_ = np.linalg.lstsq(A, xs, rcond=None) return coef
ys = np.array([200.0, 300.0, 400.0])xs = np.array([320.0, 330.0, 344.0])a, b, c = (float(v) for v in fit_lane(ys, xs))print(round(a, 1), round(b, 3), round(c, 5)) # -> 296.0 0.1 0.0001print(round(a + b * 500 + c * 500**2, 1)) # -> 371.0The extension to row 500 is the usable output for control, not the raw votes.
Watch Out For
Tar seams and shadows that look like paint
Longitudinal tar strips and guardrail shadows form straight dark-light edges that score like lane borders. The symptom is a confident phantom lane pulling the car toward a barrier. The fix pairs appearance with geometry priors: expected count, width, parallelism, and temporal persistence before accepting a new line.
The Quick Version
- Lane detection outputs curves per line, not just bright pixels.
- Row-wise votes plus curve fitting bridge gaps and glare.
- Ground-plane fitting straightens perspective on flat roads.
- Judge by curve distance and false lines, not pixel accuracy.
- Temporal smoothing decides production stability.