Weights Biases Run Tracking
A hosted run diary for experiments: log metrics, images and configs per run, then compare sweeps on shared charts.
Why Does This Exist?
Vision sweeps produce hundreds of runs across machines, and spreadsheets collapse under them. Which learning rate won, on which commit, with which augmentation? Weights and Biases answers by logging every run to one hosted record: scalars, configs, image samples and model artifacts, grouped into sweeps with shared charts. Dataset preparation choices and classification scores become comparable instead of anecdotal.
This page covers the logging contract, one averaging fixture, and appropriate use.
Think of It Like This
A lab notebook with carbon copies
Every experiment gets a numbered page: date, recipe, measurements, taped-in photos. Carbon copies fly to a shared binder where anyone can rank pages by result.
That binder is the dashboard. Runs are pages, sweeps are chapters. The analogy stops at ink: paper cannot re-plot old pages on new axes, while logged runs can.
How It Actually Works
Input is a run init plus log calls: scalars per step, config dicts once, image grids and artifacts at milestones. Output is versioned run records with queryable charts and tables. Purpose is comparable experiment history with image evidence attached. Appropriate use is multi-run training and sweeps with shared review. Log configs as data, not prose, so filters and grouping stay exact across teammates.
Averaging fixture
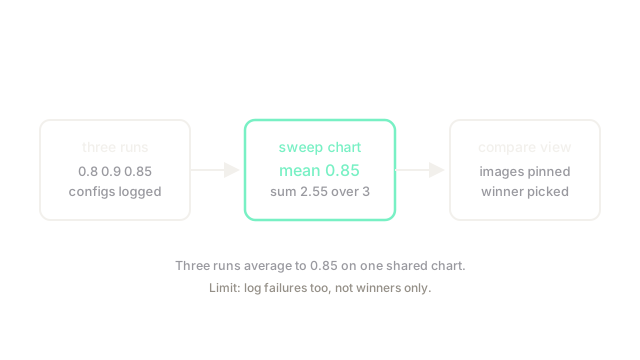
Take logged accuracies . The sum is . The mean is . The dashboard draws that line across the three points, which is the comparison the diagram shows.
Code
Mean in plain Python, the chart's center line:
def mean(xs: list[float]) -> float: return sum(xs) / max(len(xs), 1) # average of logged points
print(round(mean([0.8, 0.9, 0.85]), 3)) # -> 0.85Three logged points average exactly to 0.85.
Watch Out For
Logging only the winners
Teams log strong runs and skip crashes, so the dashboard praises a lucky seed. The symptom is a method that reproduces at half the reported gain. Fix it by logging every launched run with its config and marking failures explicitly.
The Quick Version
- Weights and Biases maps training runs to versioned records with charts.
- Histories 0.8, 0.9, 0.85 average exactly to 0.85.
- Log scalars, configs, image samples and artifacts together.
- Use it for sweeps and shared review across machines.
- Log every run including failures, or comparisons lie.