A/B Testing for ML
How to evaluate a model's business impact using statistical experiments.
Why Does This Exist?
When you train a machine learning model, you evaluate it offline using metrics like RMSE, F1-score, or AUC. But high offline accuracy does not guarantee business impact. A recommendation model might have a perfect F1-score because it recommends popular items everyone buys anyway, providing zero incremental lift.
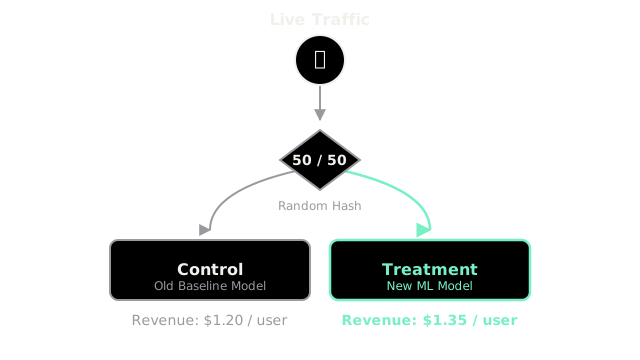
A/B testing exists to bridge the gap between model accuracy and business value. By randomly assigning half of your users to experience the old system (Control) and half to experience the new ML model (Treatment), you create a Randomized Controlled Trial (RCT). This physical randomization severs all confounding variables, proving that any difference in revenue, click-through rate, or retention was definitively caused by the new model.
Think of It Like This
Think of It Like This
Imagine you invent a new fertilizer that you believe makes tomatoes grow faster. You can't just spray it on a field and declare success if the tomatoes are big—maybe it was just a very sunny year. You have to take a field, draw a line down the middle, spray one side with the new fertilizer (Treatment) and the other side with water (Control). If the treated side grows taller, you know the fertilizer caused it, because the sun and rain hit both sides equally.
How It Actually Works
A standard A/B test has three core components: the randomization unit, the metrics, and the statistical test.
1. The Randomization Unit
You must decide what to randomize. If you randomize by page view, the same user might see the Control model on Monday and the Treatment model on Tuesday, ruining the experiment. In ML, we usually randomize by User ID (hashing the ID to assign them to a bucket) to ensure a consistent user experience.
2. Guardrail and Primary Metrics
Offline ML metrics (like Log Loss) are useless in an A/B test. Instead, we define:
- Primary Metric (OEC - Overall Evaluation Criterion): What are we trying to improve? (e.g., Conversion Rate, Revenue per User).
- Guardrail Metrics: What are we afraid of breaking? (e.g., Latency, App Crashes, Unsubscribe Rate). A test that increases revenue but quadruples latency is a failure.
3. Hypothesis Testing
Once the test concludes, we have two means: and . We use a statistical test (like a two-sample t-test) to calculate a p-value. The p-value answers the question: If the new model actually had zero effect, how likely is it that we would see a difference this large just by random noise? If , we reject the null hypothesis and declare the model a winner.
Code
Here is a simplified simulation of evaluating an A/B test using a two-sample t-test to check if the new ML model significantly improved the conversion rate.
import numpy as npimport scipy.stats as stats
np.random.seed(42)
# Simulate 10,000 users in each groupn_control = 10000n_treatment = 10000
# Control group: Baseline conversion rate is 5.0%# 1 = Converted, 0 = Did not convertcontrol_conversions = np.random.binomial(1, 0.050, n_control)
# Treatment group: New ML model conversion rate is 5.6%treatment_conversions = np.random.binomial(1, 0.056, n_treatment)
# Calculate meansmean_c = np.mean(control_conversions)mean_t = np.mean(treatment_conversions)absolute_lift = mean_t - mean_crelative_lift = (absolute_lift / mean_c) * 100
print(f"Control Conversion: {mean_c:.4f}")print(f"Treatment Conversion: {mean_t:.4f}")print(f"Relative Lift: +{relative_lift:.2f}%")
# Perform a two-sample t-testt_stat, p_value = stats.ttest_ind(treatment_conversions, control_conversions)
print(f"\nT-statistic: {t_stat:.2f}")print(f"P-value: {p_value:.5f}")
if p_value < 0.05: print("Result: STATISTICALLY SIGNIFICANT. Deploy the new ML model!")else: print("Result: NOT SIGNIFICANT. The lift might just be noise.")Watch Out For
Peeking at the data (The Peeking Problem).
If you run an A/B test for two weeks, but you check the p-value every day and stop the test the moment , your results are invalid. Continuous checking massively inflates your False Positive Rate. You must either wait for the predetermined sample size, or use Sequential Testing.
Network Effects (Interference).
If you are testing a pricing ML model on a two-sided marketplace (like Uber or Airbnb), treating User A affects the prices and availability for Control User B. This violates the Stable Unit Treatment Value Assumption (SUTVA). You cannot run a standard A/B test here; you must use switchback testing or geo-based randomization.
The Quick Version
- A/B Testing is a Randomized Controlled Trial applied to software and ML models.
- It proves causal business impact, bridging the gap between offline accuracy and online value.
- You must randomize carefully (usually by User ID) and measure business metrics, not ML metrics.
- Statistical significance guarantees that the observed lift wasn't just random noise, provided you don't peek at the results early.