GPU Utilization and Profiling
You rented a $30,000 GPU and ran your code. The GPU says it is at 100% usage, but your code is still slow. Profiling allows you to see exactly what the GPU is actually doing every microsecond, revealing that it's just spinning its wheels waiting for memory.
Why Does This Exist?
If you want to know how hard your computer is working, you open the Task Manager and look at CPU usage (e.g., 85%).
For GPUs, engineers type nvidia-smi into the terminal. It might say Volatile GPU-Util: 100%. You might assume you have perfectly optimized your ML code. You haven't.
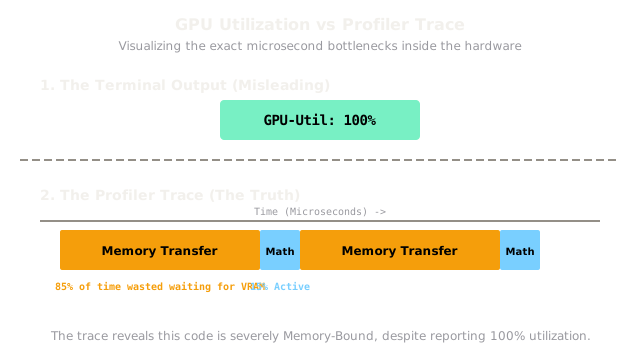
nvidia-smi is dangerously misleading. It only checks if any part of the GPU was active during the last second.
Modern GPUs have distinct sections: Tensor Cores (the hyper-fast math calculators) and Memory Bandwidth (the pipes that move data). If your code is terribly unoptimized, the Tensor Cores might sit completely idle while the Memory pipes struggle to move data. nvidia-smi will still proudly report 100% utilization.
To actually optimize your code, you must use a Profiler. A profiler records exactly what every microscopic transistor of the GPU is doing at every single microsecond, generating a visual timeline (a Trace) so you can find the true bottlenecks.
Think of It Like This
Think of It Like This
Imagine a construction site building a house.
If you ask the foreman (like nvidia-smi) "Are people working?", they will say "Yes, 100%!"
But if you set up a high-speed camera (a Profiler), you see the truth: 10 master carpenters (Tensor Cores) are standing around drinking coffee for 50 minutes because 1 apprentice (Memory Bandwidth) is slowly walking to the lumber yard to get wood. The site is technically "100% active", but the efficiency is terrible.
The Two Types of Bottlenecks
When you read a Profiler Trace, you are looking to see which of these two bottlenecks is slowing down your model:
1. Memory-Bound
Your math is very fast, but loading the data is very slow.
- The Trace shows: Long, wide blocks of memory transfers, followed by tiny, microscopic slivers of actual math execution.
- The Fix: You need to move less data. Use
compilation-and-kernel-fusionto merge operations, or usemodel-quantizationto shrink the size of the data so it travels faster.
2. Compute-Bound
Your data loads instantly, but the math is incredibly complex and takes a long time.
- The Trace shows: Instant data transfers, followed by massive, thick blocks of math execution where the Tensor Cores are running at maximum capacity.
- The Fix: Congratulations! This is exactly what you want. The only way to go faster here is to buy a better GPU or redesign your neural network architecture.
Code
PyTorch comes with a built-in Profiler that generates a JSON trace file. You can then open this file in Google Chrome by typing chrome://tracing in your URL bar.
import torchimport torch.profilerimport torchvision.models as models
model = models.resnet18().cuda()inputs = torch.randn(5, 3, 224, 224).cuda()
# Start the Profilerwith torch.profiler.profile( activities=[ torch.profiler.ProfilerActivity.CPU, torch.profiler.ProfilerActivity.CUDA, ], # Save the visual timeline to a file on_trace_ready=torch.profiler.tensorboard_trace_handler('./log_dir')) as prof: # Run the math model(inputs) # Tell the profiler this step is done prof.step()
# Now open Chrome -> chrome://tracing -> Load the JSON fileFor absolute maximum precision, hardcore ML engineers skip the PyTorch profiler and use Nvidia's native tool, nsys (Nsight Systems), via the command line.
Watch Out For
The CPU Overhead Illusion.
Sometimes, you look at a GPU Trace, and you see massive gaps of completely empty space where the GPU is doing absolutely nothing. This is usually a CPU bottleneck! The GPU finished its math in 1 millisecond, but the Python code running on the CPU took 50 milliseconds to calculate the next instruction to send to the GPU. During those 50ms, the GPU went to sleep. To fix this, you must optimize your data loading DataLoader or use torch.compile to bypass Python overhead.
The Quick Version
nvidia-smilies. 100% GPU utilization does not mean your code is running efficiently.- You must use a Profiler (PyTorch Profiler or
nsys) to generate a microsecond-level visual timeline of execution. - If your trace shows long memory transfers and short math execution, your code is Memory-Bound.
- If your trace shows short memory transfers and long math execution, your code is Compute-Bound (which is the goal).
- Massive empty gaps in a GPU trace usually indicate that the Python CPU code is too slow to feed the GPU.