Precision-Recall Curve
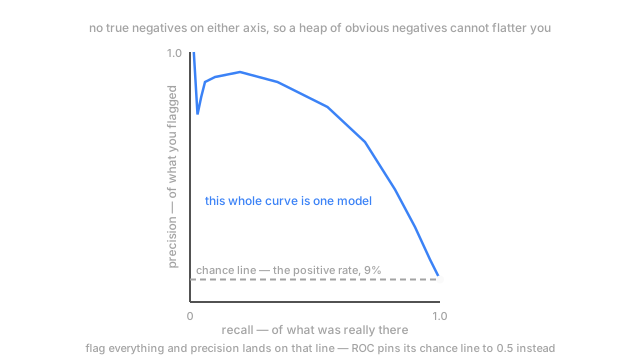
Neither axis touches the true-negative count, so a huge pile of obvious negatives can't flatter you. The baseline is the positive class rate, not one half.
Why Does This Exist?
Ten thousand subscribers, 900 of them cancelling next month. A model scores everyone for cancellation risk and the top slice gets a retention offer: two months at half price, which costs money every time it lands on somebody who was never leaving.
Two numbers matter. Of the people you sent the offer to, how many were going to cancel — that's precision, what the discount budget buys. Of the 900 leaving, how many did you reach — that's recall, the revenue you saved.
Now grow the business. Same model, same threshold, same 900 leavers, but 30,000 subscribers. On a ROC curve almost nothing happens: recall is unchanged and the false positive rate moves half a point, because the extra 20,000 land in an already-large denominator. Precision falls from 0.50 to 0.23.
One view says nothing changed. The other says the economics broke. This is the one that noticed.
Think of It Like This
Panning two bends of the same river
You're panning for gold. Swirl the pan, let the light gravel wash over the lip, keep what settles. Two numbers describe how you did: of what stayed in the pan, how much was gold, and of the gold that passed through, how much you kept.
Move upstream to a richer bend and pan exactly the same way, with exactly the same skill. Your keep pile is suddenly mostly gold. Move to a barren stretch and it's grit. Your technique didn't change — the river did — so a score built from that pile describes the river as much as you.
And notice what neither number counts: the tonnes of ordinary gravel you correctly let wash away. Thousands of right calls an hour, and they appear nowhere. Nobody weighs the gravel you didn't keep.
How It Actually Works
Two axes, and the count missing from both
Precision is the flags that were right over everything you flagged. Recall is that same numerator over everything that really was positive. Something is absent from both: the count of negatives the model correctly left alone.
That one fact is the whole difference from ROC. The false positive rate divides your false alarms by the entire negative class, so a mountain of obvious negatives inflates that denominator and shrinks the rate. Precision divides them by the flags you made, which doesn't grow with the population.
So hold the threshold still and add 20,000 subscribers who were never going to leave. Recall can't move — its denominator is the 900 leavers. The false positive rate barely moves, because you added to both its numerator and its huge denominator. Precision falls hard, because you added to its denominator only.
The baseline moved, so the number moved
A random classifier's PR curve is a flat line at the positive rate, not at 0.5. Flag people at random and the share of your flags that were leavers is just the share of leavers in the population. On a 9%-churn base, chance is 0.09.
Which means average precision, the standard summary of this curve, is only interpretable next to the prevalence it came from. An average precision of 0.4 is strong on a 2%-positive problem, where it beats chance twentyfold. The same 0.4 on a 45%-positive problem is barely better than a coin. ROC's chance line stays pinned to 0.5 whatever the class balance does, and that stability is what makes it blind here.
The sawtooth, and which summary to trust
The curve isn't monotone, which surprises people who've only seen ROC. Walk the threshold down one prediction at a time: each is either a hit, nudging precision up, or a miss, dragging it down. Recall only climbs, so the path zigzags.
At the low-recall end the zigzag has visible teeth. Up there the threshold is high, you've flagged maybe eight people, and precision's denominator is eight, so one case flipping moves the number by more than a tenth.
Which is also why average precision beats a trapezoidal area. In precision-recall space a straight line between two operating points describes a classifier that doesn't exist, so the trapezoid comes out optimistic. Average precision instead sums each step in recall times the precision at that step. average_precision_score does that; auc(recall, precision) doesn't.
Code
The same 900 leavers, the same threshold, and a subscriber base that keeps growing.
import numpy as np
rng = np.random.default_rng(8)
def at_cut(churn: np.ndarray, stay: np.ndarray, cut: float) -> tuple[float, float, float]: tp, fp = int(np.sum(churn >= cut)), int(np.sum(stay >= cut)) # neither recall nor precision ever divides by the stayers the model got right return tp / churn.size, tp / max(tp + fp, 1), fp / stay.size
churn = np.clip(rng.normal(0.55, 0.16, 900), 0.0, 1.0) # the same 900 leavers every timefor n in (9_100, 29_100, 99_100): stay = np.clip(rng.normal(0.22, 0.16, n), 0.0, 1.0) recall, precision, fpr = at_cut(churn, stay, 0.45) print(f"{n:>6} stayers recall {recall:.3f} precision {precision:.3f} fp rate {fpr:.3f}")# -> 9100 stayers recall 0.728 precision 0.503 fp rate 0.071# -> 29100 stayers recall 0.728 precision 0.232 fp rate 0.075# -> 99100 stayers recall 0.728 precision 0.080 fp rate 0.076Recall is identical to three decimals across all three runs, because its denominator never changed. The false positive rate moves half a point. Precision goes from 0.503 to 0.080 — half your offers landing on real leavers, down to one in twelve. Track the false positive rate and that stays invisible.
Watch Out For
Comparing average precision across datasets with different positive rates
The symptom is a model that looks like it regressed and didn't. Last quarter's average precision was 0.44, this quarter's is 0.31, nobody touched the model, and a week disappears into diffing feature pipelines. Meanwhile churn fell from 9% to 6%. The baseline dropped underneath the number.
Never quote average precision without the prevalence beside it, and use the lift over chance — average precision divided by the positive rate — when you have to compare two populations. Same rule kills the other version: benchmarking against a published average precision on somebody else's dataset. Different positive rate, different baseline, incomparable numbers.
Reading the sawtooth as something the model is doing
Somebody points at the spiky corner and concludes the model is unstable on its most confident predictions, or that the threshold sweep has a bug. Then a proposal appears to smooth the curve before plotting.
Both readings are wrong. Precision up there is computed over a handful of predictions, sometimes fewer than ten, so it can only take coarse values and jumps between them as single cases flip. The teeth are a small-denominator artefact and they'd appear on a flawless model. Don't smooth them; that hides how little evidence sits behind the high-confidence region. Report precision at a fixed number of flags instead — precision at the top 100, say — which pins the denominator.
The Quick Version
- Precision on the vertical, recall on the horizontal, one point per threshold. Neither axis involves the true-negative count.
- That's the whole difference from ROC. A growing pile of obvious negatives can't inflate a denominator, so it can't flatter you.
- Hold the threshold and add negatives: recall untouched, false positive rate barely moves, precision falls hard.
- Chance sits at the positive rate, not 0.5, so average precision only means something next to its prevalence.
- The curve saw-tooths at the low-recall end, where precision's denominator is a handful of cases.
- On rare-event problems, report this curve. Keep ROC for comparing rankings.