Classification Metrics
Precision prices a false alarm, recall prices a miss, and one threshold moves both. Every number you report is a claim about which mistake you'd rather make.
Why Does This Exist?
A support inbox takes 40,000 tickets a week. About 300 are an account being taken over — a stranger inside, the recovery email changed, money moving — and those need a security engineer within the hour.
Your model flags 1,100 tickets and catches 210 of the 300.
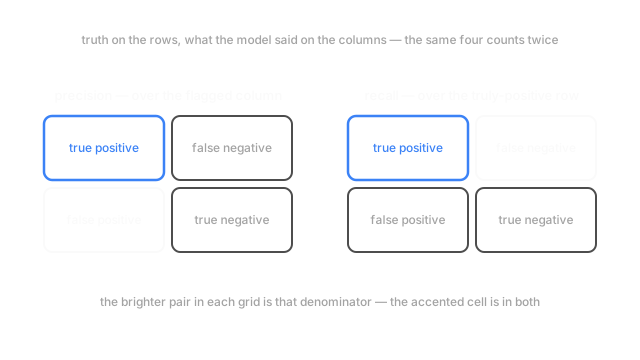
Is that good? One number can't say, because two questions are hiding in there and they disagree. Of the 1,100 you flagged, 210 were real: 0.19. Of the 300 real ones, you caught 210: 0.70.
Those are precision and recall, and they exist separately because they price different mistakes. A false alarm costs eleven minutes of engineer time on a password reset dressed up as an intrusion, plus the odd frozen account belonging to somebody innocent. A miss gives the attacker another four days.
Mechanically they're one count over two totals — everything you flagged, everything that really was a takeover. That's the diagram. The confusion matrix has the four counts themselves.
Think of It Like This
The mesh size on a fishing net
You're after mackerel, and your net has one setting that matters: how wide the holes are.
Tight mesh and almost nothing escapes — every mackerel in the water, plus seaweed, jellyfish, bottles and undersized fish you throw back. Huge haul, mostly junk.
Open the mesh and the haul comes back clean, nearly all keepers. But most of the mackerel swam through, and you'll never know how many.
No third setting gets both right, because one hole size does both jobs. And each number is trivially faked alone: strain the whole sea and you caught 100% of the mackerel. Refuse to fish and everything in your empty net is a mackerel.
How It Actually Works
One dial, two numbers, and how to game both
A classifier hands you a score, not a yes, and somebody picks the cut above which a score becomes a flag. That cut is the mesh size. Lower it and recall climbs while precision falls. Raise it and both reverse. One control, two numbers, permanently opposed.
Which is why either alone isn't a measurement. Flag all 40,000 tickets and recall is exactly 1.0 with precision at 0.0075. Flag nothing and precision reads 1.0, or undefined depending on the library, with recall at zero. Both are one line of code away.
Why F1 refuses to average, and what beta is for
F1 is the harmonic mean of precision and recall :
Harmonic rather than ordinary averaging is the whole point, and you see it by breaking it. Precision 0.99 with recall 0.01 describes a model that flags three tickets a week, is right about nearly all of them, and sleeps through 99% of intrusions. Average those the ordinary way: 0.50, a respectable-looking score for something close to worthless. F1 gives 0.0198.
A harmonic mean sits near the smaller input and can't be rescued by the larger one. Drive 100 km out at 100 km/h and 100 km back at 1 km/h and you averaged 1.98 km/h, not 50.5, because the slow leg eats all the time.
But F1 carries an assumption it never states — precision and recall matter equally — and for a takeover queue that's false. F-beta makes it a parameter:
Here is how many times more you care about recall than precision. At 1 you're back to F1; at 2, recall's side of the mean carries four times the weight, because the weighting goes as . Choosing is a costing exercise, not a modelling one: engineer minutes on one side, whatever your incident write-ups say a takeover costs on the other.
Averaging over more than two classes
Same inbox, bigger job: four queues instead of a yes or no — how-do-I, billing, bug report, takeover. Precision and recall are per class now, so a headline needs an average, and three conventions disagree.
Macro weights every class equally, so takeover at 1% of volume counts as much as how-do-I at 86%. Rare classes get a full vote. Micro pools all the counts first, and since each ticket contributes exactly one prediction and one truth, the pooled precision and recall come out identical — micro F1 is accuracy under another name, and it follows the biggest class. Weighted averages by frequency and lands beside micro.
Code
Four queues, badly uneven traffic, and a model that's good on the big class and poor on the small ones.
import numpy as np
def fbeta(truth: np.ndarray, pred: np.ndarray, cls: int, beta: float) -> float: tp = np.sum((pred == cls) & (truth == cls)) p, r = tp / max(np.sum(pred == cls), 1), tp / max(np.sum(truth == cls), 1) b2 = beta * beta # b2 is the weight on recall's side, so beta=2 counts a miss 4x return float((1 + b2) * p * r / max(b2 * p + r, 1e-12))
rng = np.random.default_rng(5)share = np.array([0.86, 0.11, 0.02, 0.01]) # how-do-I, billing, bug report, takeovertruth = rng.choice(4, 40_000, p=share)slip = rng.random(40_000) < np.where(truth == 0, 0.04, 0.55) # the rare classes fail morepred = np.where(slip, (truth + 1) % 4, truth) # a slip lands on the neighbouring queueper = [fbeta(truth, pred, c, 1.0) for c in range(4)]print(f"per-class F1 {np.round(per, 3)}")print(f"macro {np.mean(per):.3f} weighted {np.dot(share, per):.3f} micro {np.mean(truth == pred):.3f}")print(f"takeover queue F1 {fbeta(truth, pred, 3, 1.0):.3f} F2 {fbeta(truth, pred, 3, 2.0):.3f}")# -> per-class F1 [0.977 0.508 0.204 0.338]# -> macro 0.506 weighted 0.903 micro 0.888# -> takeover queue F1 0.338 F2 0.396Macro 0.51, micro 0.89, weighted 0.90, from identical predictions. Micro isn't lying — 89% of tickets really do get routed correctly. Almost all of that is the how-do-I class, and the queue you built the thing for scores 0.338.
Watch Out For
Shipping F1 as though it were the neutral option
The symptom is a model card with one number on it and no threshold beside it. Somebody asks why the takeover queue keeps missing intrusions, and the answer is a default accepted six months ago: beta=1, precision and recall equally weighted. Nobody chose it. It was the shape of the function call.
F1 is a position, not a baseline. Price both mistakes, set from the ratio, and report the threshold you evaluated at. Report alongside raw precision and recall, never instead of them — one number can't tell a reader which way the model fails.
Quoting micro-averaged F1 as evidence the rare classes work
A dashboard reads 0.89 micro F1 across four queues and the review moves on. Then takeovers turn out to be landing in billing, and the per-class numbers are 0.98, 0.51, 0.20 and 0.34. Nothing was misreported: micro pools every count into one bucket, so a class holding 1% of the rows contributes about 1% of the evidence.
Report per-class precision and recall, always, and put macro beside micro so the gap shows. Then check the rare class is measurable at all: 400 takeovers over five folds is 80 a fold, so eight tickets move recall ten points. Stratified sampling keeps folds comparable.
The Quick Version
- Precision is of what you flagged, how much was real. Recall is of what was real, how much you flagged.
- One threshold moves both, opposite ways, and either can be maxed out alone. Neither means anything without the other and its threshold.
- F1 is the harmonic mean, so it sits near the weaker half: precision 0.99 with recall 0.01 scores 0.02, not 0.50.
- F1 hard-codes "these matter equally". F-beta makes that a number, weighted as , and setting it is a costing exercise.
- Macro gives rare classes a full vote, micro equals accuracy and follows the majority. That one choice moved the headline from 0.51 to 0.89 on identical predictions.