Probabilistic Forecasting
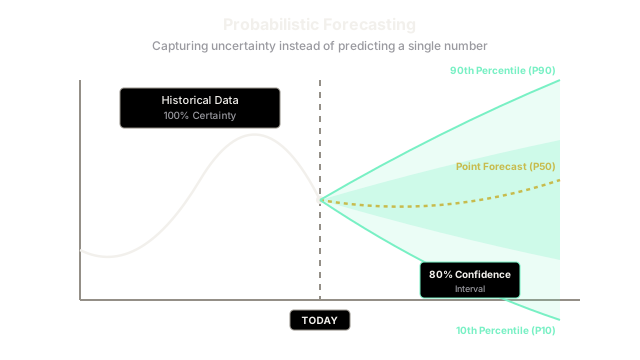
Instead of predicting exactly what a single number will be tomorrow, probabilistic models predict a range of possibilities, outputting a distribution with confidence intervals (e.g., 'we are 90% sure sales will be between 50 and 80').
Why Does This Exist?
Imagine you manage the inventory for a hospital. You need to know how many flu vaccines to order for next month.
A standard time series model (like XGBoost) gives you a Point Forecast. It outputs exactly one number: 1,500 vaccines.
If the model is slightly wrong and the real demand is 1,600, 100 patients will not get vaccinated. For high-stakes decisions, knowing the "most likely" number is not enough. You need to know the worst-case scenario and the best-case scenario.
Probabilistic Forecasting doesn't predict a single number. It predicts a Probability Distribution. It tells you:
- "There is a 50% chance demand will be 1,500."
- "There is a 95% chance demand will be below 1,800." You can now safely order 1,800 vaccines, knowing you are mathematically covered in 95% of possible futures.
Think of It Like This
Think of It Like This
Imagine a hurricane forecast on the news.
The meteorologist does not draw a single, thin line on the map showing exactly where the center of the hurricane will go. That would be a Point Forecast, and it implies a false sense of absolute certainty.
Instead, they draw a "Cone of Uncertainty". The cone starts narrow and gets much wider as it stretches into the future, reflecting that predicting 5 days out is much harder than predicting 1 day out. Probabilistic Forecasting is simply drawing that hurricane cone for your business metrics.
How It Actually Works
There are two main ways to generate probabilistic forecasts.
1. Quantile Regression
Most machine learning models (like Neural Networks or Gradient Boosting) are trained using Mean Squared Error (MSE), which explicitly forces them to predict the average (the mean).
If you change the loss function to Quantile Loss (Pinball Loss), the exact same model will learn to predict specific percentiles instead of the average.
- You train the model to predict the 10th percentile (P10).
- You train the model to predict the 50th percentile (the Median, P50).
- You train the model to predict the 90th percentile (P90).
When you plot P10 and P90 on a chart, you instantly get an 80% confidence interval.
2. Parametric Distributions (e.g., DeepAR)
Amazon's famous DeepAR model takes a different approach. Instead of predicting raw numbers, the neural network predicts the parameters of a bell curve. It looks at the data and outputs two numbers:
- (Mu): The mean.
- (Sigma): The standard deviation (how wide the bell curve is).
If the model is highly uncertain about the future, it outputs a very large , creating a massive cone of uncertainty.
Code
Many modern time series libraries support probabilistic forecasting out of the box. Here is how you do it using the darts library with a DeepAR model.
from darts.models import RNNModelfrom darts.utils.likelihood_models import GaussianLikelihoodimport matplotlib.pyplot as plt
# 1. Initialize an LSTM model# Instead of predicting a flat number, we tell it to output a Gaussian (Bell Curve) distributionmodel = RNNModel( input_chunk_length=30, likelihood=GaussianLikelihood())
# 2. Train the modelmodel.fit(series, epochs=50)
# 3. Forecast the next 30 days# Because we used a Likelihood model, the forecast automatically contains # 100 different simulated futures (samples).forecast = model.predict(n=30, num_samples=100)
# 4. Plot the forecast# This will automatically draw the "Cone of Uncertainty" using the 5th and 95th percentilesseries.plot(label="Actual")forecast.plot(label="Forecast", low_quantile=0.05, high_quantile=0.95)plt.show()Watch Out For
Evaluation is much harder.
You cannot evaluate a probabilistic forecast using standard metrics like RMSE (Root Mean Squared Error) because there is no single "prediction" to compare against the "actual". You must use probabilistic metrics like CRPS (Continuous Ranked Probability Score), which measures how well the predicted distribution covers the actual outcome.
The Quick Version
- Point forecasts predict a single, rigid number for the future.
- Probabilistic forecasts predict a range of possibilities, allowing businesses to plan for worst-case and best-case scenarios.
- You can achieve this using Quantile Regression (predicting specific percentiles like P10 and P90) or by having a neural network output the parameters of a statistical distribution (like the mean and variance).
- Probabilistic forecasts naturally widen the further into the future you predict, reflecting increasing uncertainty.