Propensity and LTV
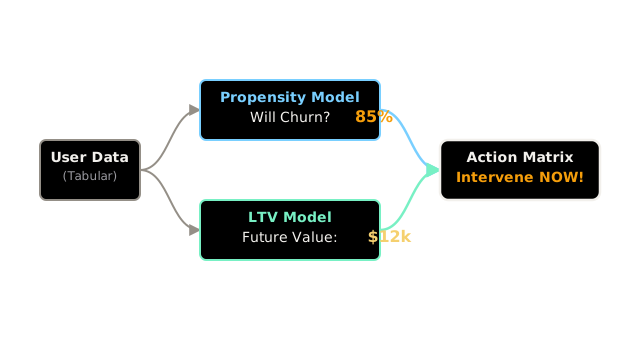
Instead of treating every customer equally, you calculate two numbers: how likely are they to do something (Propensity), and how much money will they generate over their entire relationship with you (Lifetime Value)?
Why Does This Exist?
In consumer software, e-commerce, and gaming, you have millions of users. If you spend marketing dollars, server resources, or human support time equally on all of them, your business will fail. You need to focus your resources on the users who matter most.
The foundation of modern data-driven business relies on two fundamental ML models:
- Propensity Models (Classification): Predicting the probability that a user will take a specific action (e.g., Will they churn next month? Will they click this ad? Will they buy a subscription?).
- Lifetime Value (LTV) Models (Regression): Predicting the total revenue a user will generate for the business over their entire lifespan.
Together, these models transform a raw database of users into an actionable priority list, dictating who gets a discount, who gets a phone call from sales, and who is safely ignored.
Think of It Like This
Think of It Like This
Imagine you are managing a casino. You have limited free drinks and hotel upgrades to give out. If you give them to random people, you waste money. First, you build a Propensity Model to predict who is likely to walk out the door in the next 10 minutes (Churn Propensity). Second, you build an LTV Model to predict who is a high-roller who will spend $10,000 tonight. You intersect these models: you find the High-Rollers (High LTV) who are about to leave (High Churn Propensity), and you immediately send a waiter to give them a free drink.
How It Actually Works
1. Propensity Modeling
A propensity model is simply a binary classifier (e.g., Logistic Regression, XGBoost) calibrated to output a true probability between 0 and 1, rather than a hard True/False label.
Because business events (like clicking an ad or churning) are often rare, you must handle imbalanced data carefully. If only 1% of your users churn, a model that predicts "No Churn" for everyone is 99% accurate but entirely useless. We evaluate propensity models using metrics like AUC-ROC and Precision-Recall AUC.
2. Lifetime Value (LTV / CLV) Modeling
LTV predicts continuous monetary value. The classic non-ML approach is RFM Analysis (Recency, Frequency, Monetary value), which uses heuristics to estimate future value. Modern LTV modeling uses Machine Learning (like Gradient Boosted Trees or specialized Bayesian models like Buy 'Til You Die).
The hardest part of LTV modeling is the time horizon. Do you predict their value over the next 30 days, 1 year, or 5 years? Predicting 30-day LTV is easy because the data matures quickly. Predicting 5-year LTV is incredibly difficult because you have to wait 5 years to gather the ground truth labels to train the model!
3. The Action Matrix
Businesses combine these models into a matrix to drive automated decisions:
- High LTV + High Churn Propensity: Send personalized offers, assign a human account manager.
- High LTV + Low Churn Propensity: Do nothing. Don't wake a sleeping dog or waste money on discounts for loyal whales.
- Low LTV + High Churn Propensity: Let them churn. It costs more to save them than they are worth.
Code
This code trains a simple Propensity to Churn model and a 1-year LTV model using XGBoost on historical tabular data.
import pandas as pdimport xgboost as xgbfrom sklearn.model_selection import train_test_splitfrom sklearn.metrics import roc_auc_score, mean_absolute_error
# X: Historical tabular data (login frequency, past purchases, demographics)# y_churn: Did they churn in month 2? (Binary 0/1)# y_ltv: How much did they spend in the next 12 months? (Continuous float)
X_train, X_test, y_churn_train, y_churn_test, y_ltv_train, y_ltv_test = train_test_split( X, y_churn, y_ltv, test_size=0.2, random_state=42)
# --- 1. Propensity Model (Classification) ---propensity_model = xgb.XGBClassifier( n_estimators=100, max_depth=4, objective='binary:logistic')propensity_model.fit(X_train, y_churn_train)
# Predict true probabilities, not hard labelschurn_probs = propensity_model.predict_proba(X_test)[:, 1]print(f"Churn AUC-ROC: {roc_auc_score(y_churn_test, churn_probs):.3f}")
# --- 2. LTV Model (Regression) ---ltv_model = xgb.XGBRegressor( n_estimators=100, max_depth=4, objective='reg:squarederror')ltv_model.fit(X_train, y_ltv_train)
# Predict future monetary valueltv_preds = ltv_model.predict(X_test)print(f"LTV Mean Absolute Error: ${mean_absolute_error(y_ltv_test, ltv_preds):.2f}")Watch Out For
Self-Fulfilling Prophecies.
If your propensity model predicts a user will churn, so you send them a 50% discount, they might stay. Later, when you retrain the model, the algorithm looks at the data and learns: "Users with this profile don't churn!" The model breaks its own predictions. You must hold out a global control group (users who never receive interventions) to keep the model accurately trained on raw, un-interfered behavior.
Propensity vs. Uplift.
As discussed in uplift-modeling, predicting that someone has a high propensity to buy does not mean you should send them a marketing email. It just means they were going to buy anyway. Only use propensity models for ranking or forecasting, not for deciding causal interventions.
The Quick Version
- Propensity Models estimate the probability of an action (Churn, Click, Buy) using binary classification.
- Lifetime Value (LTV) models estimate the total future monetary worth of a user using regression.
- Both models rely heavily on historical tabular data (RFM: Recency, Frequency, Monetary).
- Businesses intersect these two scores to automatically categorize millions of users and optimally distribute marketing and support budgets.