Uplift Modeling
Don't waste marketing budget on people who were going to buy anyway, and definitely don't spend it on people who will get annoyed and churn. Uplift modeling predicts who will change their behavior *because* of your intervention.
Why Does This Exist?
In traditional marketing and sales, machine learning is used to build Propensity Models. You train a model to predict: Who is most likely to buy my product? You then take the top 10% of users with the highest probability and send them a 20% discount code.
This is a massive waste of money.
The people who are most likely to buy your product were probably going to buy it anyway. By sending them a discount, you didn't cause a new sale; you just gave away 20% of your margin. To optimize a marketing budget, you shouldn't ask "Who will buy?". You should ask: "Who will buy if and only if I send them a discount?"
Uplift Modeling exists to answer this causal question. It applies the math of Heterogeneous Treatment Effects (HTE) directly to business and marketing optimization.
Think of It Like This
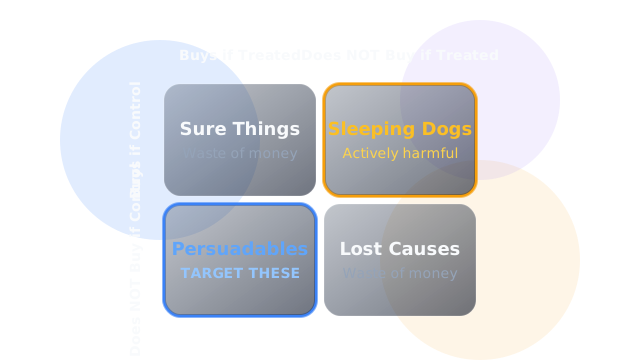
Uplift modeling divides your entire customer base into four distinct personas:
- The Persuadables: They will buy if you send the discount. They will not buy if you don't. (Target these!)
- The Sure Things: They will buy no matter what you do. (Do not target! You are wasting money.)
- The Lost Causes: They will not buy no matter what you do. (Do not target! You are wasting money.)
- The Sleeping Dogs: They will not buy if you send the discount (they get annoyed by spam and churn), but they would have stayed if you left them alone. (Do not target! You are actively harming your business.)
How It Actually Works
Uplift Modeling is simply applied CATE (Conditional Average Treatment Effect).
Calculating Uplift
Because you need both Treatment and Control outcomes to calculate Uplift, you cannot train an uplift model on standard observational data. You must first run a Randomized A/B Test (e.g., send the discount to 50% of your users randomly). Once you have that experimental data, you can train Meta-Learners (like the T-Learner or X-Learner) or Causal Forests to predict the Uplift score for every user.
Evaluating Uplift Models
Standard ML metrics (like AUC or F1-Score) do not work for uplift models because there is no ground-truth label for uplift (you can't observe both outcomes for a single user). Instead, we use Qini Curves or Uplift Curves.
- Sort all users in your test set by their predicted Uplift score (highest to lowest).
- Going down the list, calculate the actual cumulative difference in conversion rates between the treated users and control users in that percentile.
- A perfect model will show a steep curve at the beginning (capturing all the Persuadables) and a flat or downward curve at the end (identifying the Sure Things and Sleeping Dogs).
Code
You can use the CausalML library (open-sourced by Uber) to build and evaluate uplift models.
import pandas as pdfrom causalml.inference.tree import UpliftRandomForestClassifierfrom causalml.metrics import plot_qini
# X: User features# treatment: 1 (Received Discount) or 0 (No Discount)# y: 1 (Converted) or 0 (Did not convert)
# 1. Initialize the Uplift Random Forestuplift_model = UpliftRandomForestClassifier( control_name='0', n_estimators=100, max_depth=5)
# 2. Fit the model on the randomized A/B test datauplift_model.fit(X.values, treatment=treatment.map(str).values, y=y.values)
# 3. Predict the Uplift Score (CATE) for new usersuplift_scores = uplift_model.predict(X_new.values)X_new['predicted_uplift'] = uplift_scores
# 4. Target ONLY the Persuadables (e.g., Uplift > 5%)# Ignore people with high probability but low uplift (Sure Things)# Ignore people with negative uplift (Sleeping Dogs)target_users = X_new[X_new['predicted_uplift'] > 0.05]print(f"Targeting {len(target_users)} highly persuadable users.")
# 5. Evaluate the model using a Qini Curve# plot_qini(actual_y, actual_treatment, predicted_uplift)Watch Out For
Confusing Propensity with Uplift.
This is the #1 mistake in data-driven marketing. A Propensity Model predicts . An Uplift Model predicts . High propensity often correlates negatively with uplift, because people who are 99% likely to buy are, by definition, "Sure Things" with 0% uplift.
Data Requirements.
Uplift modeling is incredibly data-hungry. Because you are trying to measure a difference in probabilities, the signal-to-noise ratio is very low. If your baseline conversion rate is 2%, and your discount increases it to 2.5%, finding the specific sub-segment of users responsible for that 0.5% lift requires hundreds of thousands of rows of randomized A/B test data.
The Quick Version
- Propensity models predict who will buy. This wastes money on "Sure Things".
- Uplift models predict who will buy only because of the marketing intervention.
- It categorizes users into Persuadables, Sure Things, Lost Causes, and Sleeping Dogs.
- You train it using meta-learners or tree-based models on data from a Randomized A/B test.
- You evaluate it using cumulative metrics like the Qini Curve.