Validation Curves
Learning curves sweep data volume. Validation curves sweep one hyperparameter instead, and the U-shape it traces diagnoses over- and underfitting directly.
Why Does This Exist?
Learning curves answer "would more data help", by sweeping training set size with everything else fixed. That page draws a firm line around a different, easily confused question: "which setting of this one knob is right", with data volume fixed instead. This page is that second question, answered directly.
Here's the case we'll carry down the page. You're fitting ridge regression on 60 rows and 40 engineered features — a small clinical panel where only five features actually carry signal — and the regularization strength is the knob. Too small and the model fits the 35 useless features' noise as if it mattered; too large and it flattens the five real signals along with the noise. A learning curve, which never touches , cannot tell you anything about where to set it. A validation curve is built exactly to.
Think of It Like This
Tightening a violin string past the note
Tuning a violin string, you turn the peg and listen. Too loose, the note is flat and dull — the string can't hold enough tension to produce the pitch cleanly. Turn it further and the pitch rises and sharpens. Keep turning past the right point and the string goes shrill, then snaps.
There's exactly one region of the peg's travel where the note is true, and it isn't found by turning as far as possible in either direction — it's found by sweeping through the whole range and listening for where the pitch stops improving and starts getting worse again. Regularization strength behaves the same way against validation error: too little and the model chases noise it shouldn't trust, too much and it discards signal it should have kept, and the region worth being in is somewhere in between, found by sweeping, not by assuming more or less is always better.
How It Actually Works
Two curves, one axis, and what each one is telling you
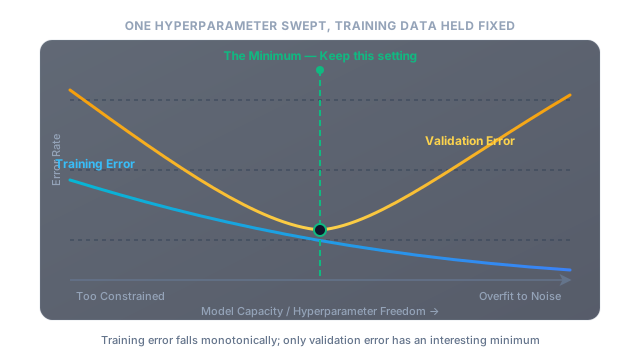
A validation curve plots two lines against a single swept hyperparameter, holding the training data and every other setting fixed: training error, which falls (or stays flat) monotonically as the model gains freedom — a weaker penalty always lets it fit the training rows at least as well — and validation error, which traces a U. High on the left, where the model is too constrained to capture even the real signal; high again on the right, where it has enough freedom to fit the training rows' noise specifically; lowest somewhere in the middle, where its capacity roughly matches what the data actually supports.
The gap between the two curves is the same overfitting signal overfitting and underfitting reads off a training-step axis — training error far below validation error means the model has started memorizing rather than generalizing — but here the horizontal axis is a hyperparameter, so the diagnosis comes with an immediate fix: move the knob back toward the U's minimum.
Choosing the swept range and the setting to keep
Sweep on a log scale whenever the hyperparameter's natural scale is multiplicative — regularization strength, learning rate, tree depth expressed as a doubling schedule — because a linear sweep bunches all its resolution at one end and wastes runs. Read the minimum of the validation curve, never the training curve, which has no minimum at all past the point where the model can memorize everything; and if the minimum sits at the edge of the swept range, the range was too narrow, not the answer.
Where this differs from a hyperparameter search, and why both exist
A validation curve sweeps exactly one hyperparameter at a fixed grid of values and is read as a diagnostic — a picture explaining why a setting is good, showing the two failure regions on either side of it. Hyperparameter tuning searches one or many hyperparameters simultaneously to find the single best combination, and is read as a result, not an explanation. In practice a validation curve on the one knob that matters most is often run first, to build intuition for the shape of the problem, before a fuller multi-parameter search is set loose on the rest.
Code
Ridge regularization strength swept across six orders of magnitude, on data where only 5 of 40 features carry real signal.
import numpy as np
rng = np.random.default_rng(4)n_tr, p = 60, 40 # few rows, many features: unregularized ridge overfits badly near alpha=0x = rng.normal(size=(n_tr + 200, p))true_w = np.r_[rng.normal(size=5), np.zeros(p - 5)] # only 5 of 40 features carry signaly = x @ true_w + rng.normal(0.0, 1.0, n_tr + 200)x_tr, x_va, y_tr, y_va = x[:n_tr], x[n_tr:], y[:n_tr], y[n_tr:]
def ridge_mse(alpha: float) -> tuple[float, float]: xb = np.c_[np.ones(n_tr), x_tr] w = np.linalg.solve(xb.T @ xb + alpha * np.eye(p + 1), xb.T @ y_tr) train_mse = float(np.mean((xb @ w - y_tr) ** 2)) val_mse = float(np.mean((np.c_[np.ones(200), x_va] @ w - y_va) ** 2)) return train_mse, val_mse
for alpha in [0.01, 1.0, 5.0, 10.0, 30.0, 100.0]: train_mse, val_mse = ridge_mse(alpha) print(f"alpha={alpha:6.2f} train MSE={train_mse:5.2f} val MSE={val_mse:5.2f}")# -> alpha= 0.01 train MSE= 0.32 val MSE= 3.83# -> alpha= 1.00 train MSE= 0.34 val MSE= 2.93# -> alpha= 5.00 train MSE= 0.58 val MSE= 2.20# -> alpha= 10.00 train MSE= 0.96 val MSE= 2.61# -> alpha= 30.00 train MSE= 2.58 val MSE= 4.66# -> alpha=100.00 train MSE= 7.48 val MSE= 8.89Training error climbs steadily as grows, exactly as expected — more penalty always costs the training fit something. Validation error does the opposite of monotonic: it falls from 3.83 to a minimum of 2.20 around , then rises again past it. That minimum, not either endpoint, is the setting worth keeping.
Watch Out For
Reading the training curve's minimum instead of the validation curve's
Training error has no interesting minimum on a validation curve — it keeps falling (or flattens) as the model gains freedom, all the way to the point of pure memorization. Someone scanning the plot quickly can mistake "still falling" for "still improving" and pick the most permissive setting on the table. Only the validation line's minimum answers the question this plot exists to answer; the training line exists purely as the comparison that reveals overfitting.
Sweeping too narrow a range and mistaking an edge for a minimum
A sweep from to that happens to bottom out at , the largest value tried, looks like a clean result. It's actually silent about everything past 10 — the true minimum could sit at 50 and never appear on the plot. Whenever the chosen setting lands at either edge of the swept range, widen the range and rerun before trusting the curve; a minimum at an edge is evidence the search was too narrow, not evidence the search is done.
The Quick Version
- A validation curve sweeps one hyperparameter with the training data fixed; a learning curve sweeps training data volume with the model fixed. They answer different questions and neither substitutes for the other.
- Training error falls (or flattens) monotonically as the model gains freedom. Validation error traces a U: too constrained on one side, overfit to noise on the other.
- The minimum of the validation curve is the setting worth keeping — never the training curve's, which has no informative minimum.
- Sweep on a log scale for multiplicative hyperparameters, and widen the range whenever the chosen setting lands at an edge.
- A validation curve is a diagnostic explaining why a setting works; a full hyperparameter search is a result finding the best combination across several knobs at once.