Functions and Graphs for ML
A function turns each input into exactly one output, and its graph draws that promise as a shape. Models are functions; training sculpts their graphs to fit data.
Why Does This Exist?
A model is a function: features in, prediction out, exactly one prediction per input. Training chooses among functions; inference evaluates the chosen one; the graph shows what was chosen. Every later idea, slope, curvature, activation shape, loss landscape, is a statement about some function's graph.
The contract has one clause: each input gets exactly one output. That single rule separates functions from general relations and makes evaluation well-defined. Slopes of these graphs are the job of derivatives and partial derivatives; evaluating whole networks of them is computational graphs.
The one idea you need first. A variable holds a number; an expression computes with it. A function names the whole input-to-output mapping so it can be reused, graphed and studied. Variables and expressions covers the pieces; this page names the mapping.
Think of It Like This
A vending machine with honest buttons
Press B4 and the same coil turns every time, dropping the same snack. That reliability is the function contract: one button, one outcome, repeatable. A machine that drops crisps or chocolate at random from B4 is a relation, not a function, and nobody trusts it.
Training stocks the machine: it decides which snack each button yields. Inference presses buttons. The graph is the stocking diagram, every button-output pair drawn at once, and reading it tells you what any press will do before you spend the coin.
Where it stops: vending machines have finitely many buttons, while math functions take infinitely many inputs. The analogy shows the contract; the graph below shows the continuum.
How It Actually Works
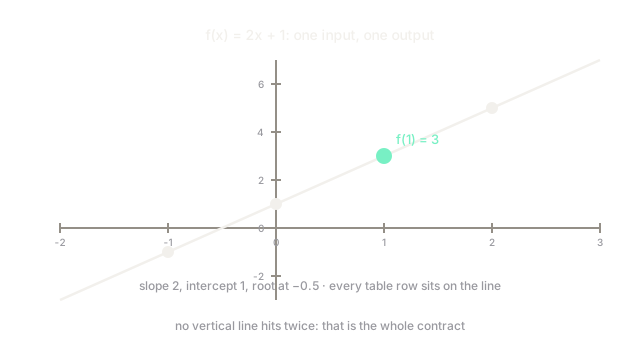
A function maps each input to exactly one output . Three views show the same mapping: the formula , a table of pairs, and the graph of plotted points . Graphs reveal at a glance what formulas hide: slope, intercepts, roots, bends.
The vertical line test enforces the contract visually: if any vertical line hits the graph twice, one input has two outputs and the relation is not a function. The circle fails at with and . Every function graph passes.
Worked example: tabulate and plot f(x) equals 2x plus 1
Evaluate at four inputs. . . . . Table: , , , .
Plot them: each step right adds 2 up, a constant slope of 2. The -intercept is , the value at . The root solves , giving . The diagram above draws this line through all four points: straight, rising, crossing at 1.
Code
def f(x: float) -> float: return 2 * x + 1
xs: list[float] = [-1.0, 0.0, 1.0, 2.0]print([f(x) for x in xs]) # -> [-1.0, 1.0, 3.0, 5.0]print(f(1.0) == 3.0) # -> TrueThe function is the mapping, the list comprehension is the table, and the last line asserts one entry of it. Models scale this pattern: the function grows to millions of parameters, the loop to millions of inputs.
Watch Out For
Calling a circle a function
looks graphable and fails the contract: at both and satisfy it. Code that solves for and keeps one branch silently discards half the curve, and downstream geometry inherits the cut.
Split relations into function branches explicitly (upper and lower semicircle) or parametrize. Never let a square root silently choose the positive half.
Reading f(x) as f times x
In , the is one symbol, "the output at ", while multiplies. Beginners distribute the or cancel it, producing artefacts like . The transcription error then compiles fine in code as a call on a wrong-named function.
Read as "f of x" aloud until it sticks. In code, the function name and the call parentheses are the same idea made executable.
The Quick Version
- A function gives each input exactly one output; the graph draws every pair at once.
- Formula, table and graph are three views of one mapping; graphs show slope and shape fastest.
- The vertical line test: two hits means not a function, like the circle.
- through : slope 2, intercept 1, root .
- Models are functions; training picks the function, inference evaluates it.