Visual explainer
Linear Regression
Fit a straight line through scattered data points by minimising the vertical errors, giving a single trend for prediction.
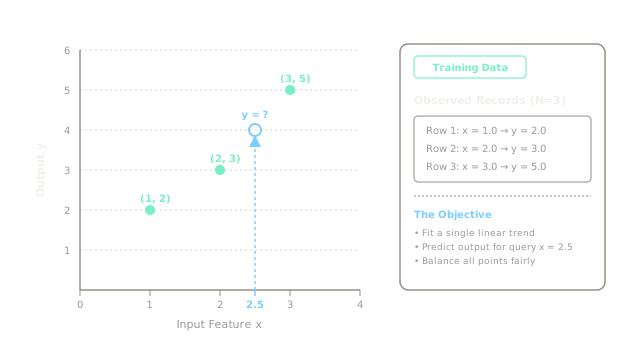
Your data arrives as a scattered cloud with no rule attached. Each dot is one past observation, and a new input sits waiting with no output. You need one straight trend that speaks for all of them.
Errors Run Vertical
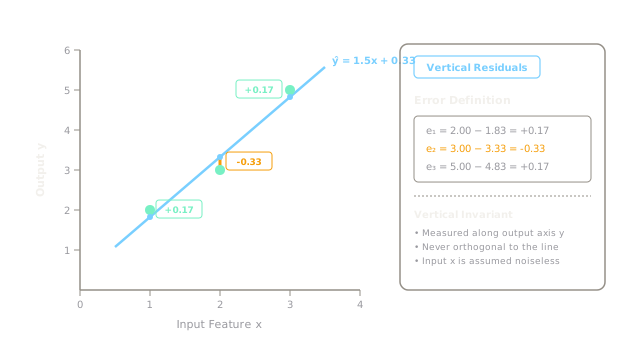
Draw a candidate line and judge it gap by gap. Each error is the vertical distance from a dot to the line, never sideways. For (1,2), (2,3), (3,5) the gaps read 0.17, minus 0.33, 0.17.
Square Every Gap
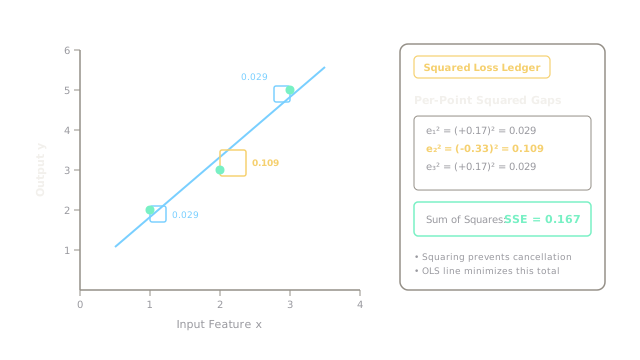
Squaring stops plus and minus gaps from cancelling out, and it punishes distant dots hardest. Your three gaps become 0.029, 0.109, 0.029, summing to 0.167. The best line makes that total smallest.
Read Off Answers
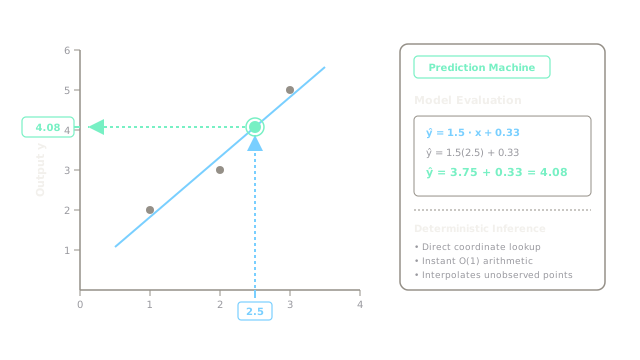
Prediction is just reading. Drop from new input x = 2.5 up to the line, slide across to the axis, and you land on 4.08. The line you fitted is now a machine that answers questions.
Proof It Worked
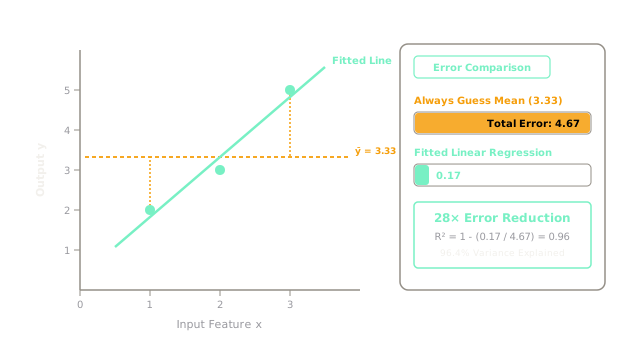
Compare against laziness. Always guessing the average 3.33 scores 4.67 on the same points, while your line scores 0.17. Fitting cuts the error to one twenty eighth. That gap is what you paid for.
Match Error To Trust
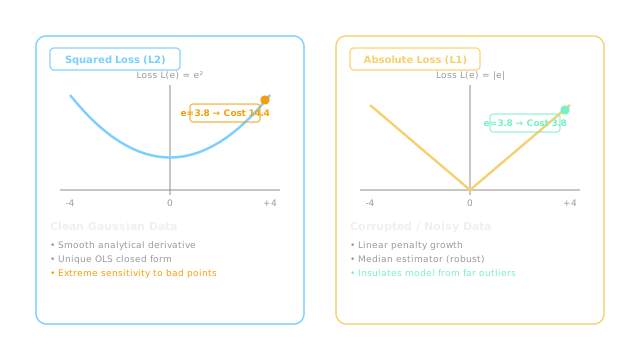
Squared error trusts every dot completely, which is brave. If one reading may be corrupt, price gaps by absolute size instead: a 3.8 gap costs 3.8, not 14.4. Match your error to your trust.
Where It Breaks
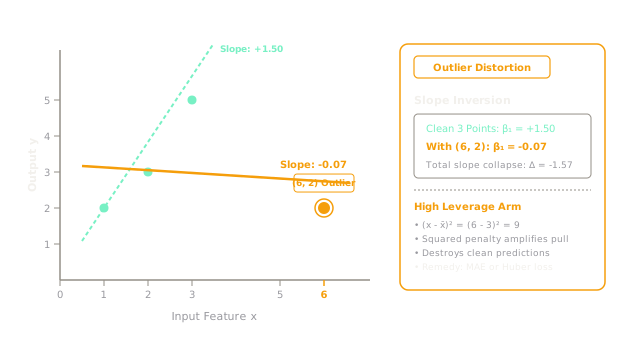
Squaring gives one far dot a megaphone. Add (6,2) to your three clean points and the slope collapses from 1.5 to minus 0.07. Everyone else pays for one bad reading. Plot first, always.
The Quick Version
- Scattered dots need one straight trend.
- Errors run vertical, never sideways.
- Squared gaps sum to 0.167 here.
- New inputs read straight off the line.
- Fitting beats guessing the average.
- Corrupt data calls for absolute error.
- One outlier flips the whole slope.