Visual explainer
Logistic Regression
Bend a straight line into an S-curve to predict probabilities for yes-or-no categories.
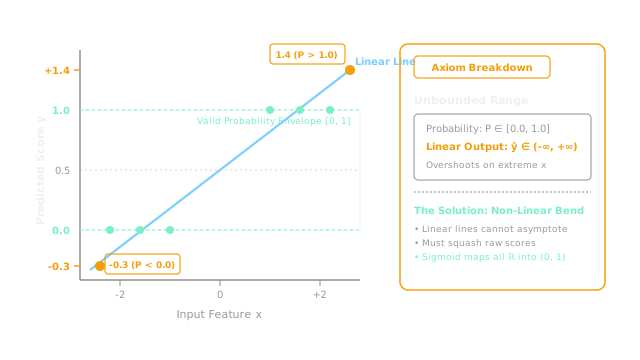
You encode no as 0 and yes as 1, then fit a line. At high inputs it shouts 1.4 and at low ones minus 0.3. Neither is a probability, so you need a bend.
Raw Scores First
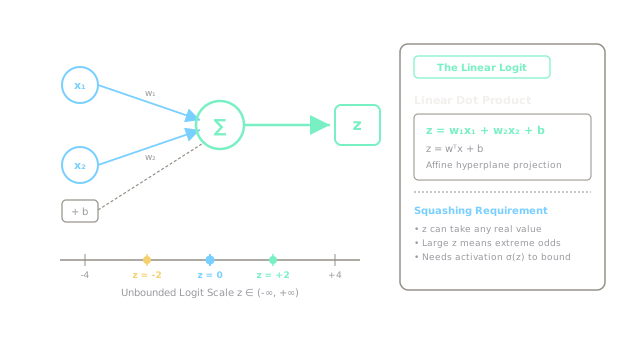
You multiply each input by its weight and add a bias. With weight 1 and bias 0, input 0 gives z of 0. That score can be any number, so it still needs squashing.
Squash With Sigmoid
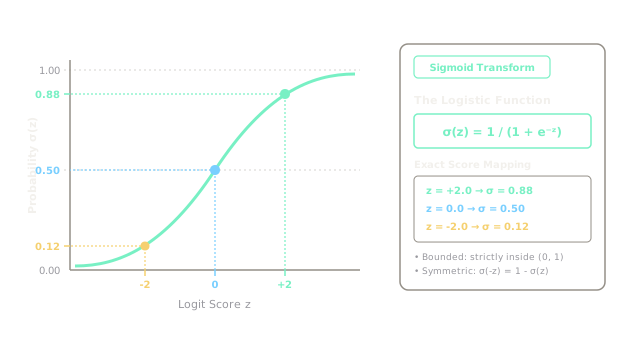
Sigmoid maps z to 1 over 1 plus e to minus z. Plug in 0 and you get 0.5 exactly. Plug in 2 and you get 0.88, while minus 2 gives 0.12.
Cut At Half
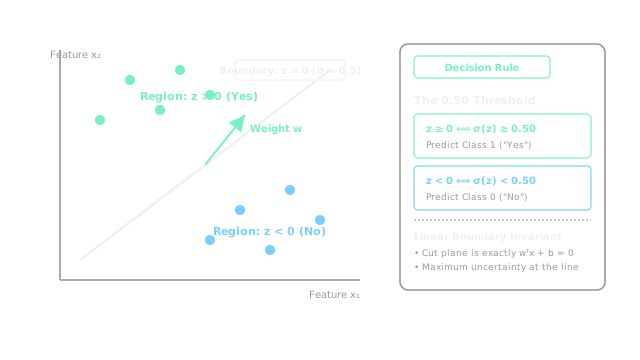
You call 0.5 your cutoff. Positive z lands above half, so you predict yes. Negative z lands below half, so you predict no. The line z equals 0 is your boundary.
Valid Odds Now
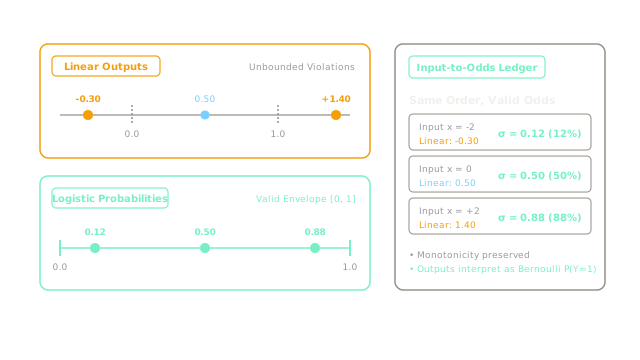
Take the same three inputs. The line gave 1.4, 0.5, and minus 0.3. The curve gives 0.88, 0.5, and 0.12. Same order, but every output now reads as odds.
Move The Cutoff
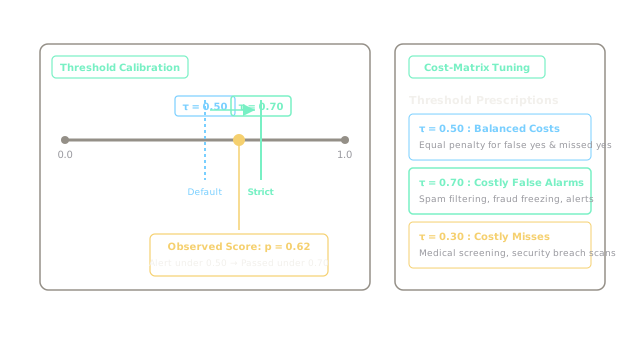
You stick with 0.5 when mistakes cost the same. When a false yes hurts more, you demand 0.7 before you act. Flip back to 0.5 when you fear missing a real yes.
Where It Breaks
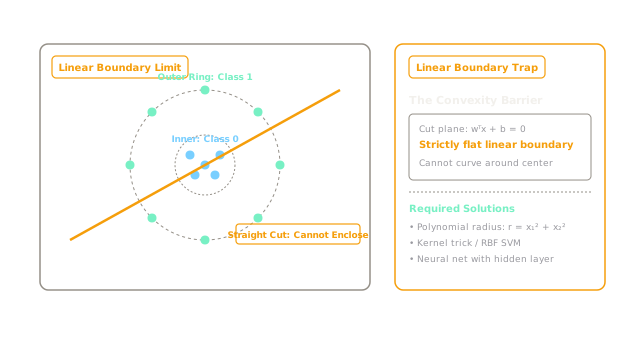
Under the curve sits a straight line, so your border stays flat. When yes points form a ring around no points, no tilt fixes it. You need curves or hidden layers instead.
The Quick Version
- Straight lines shout 1.4 and minus 0.3.
- Weights plus bias give raw score z.
- Sigmoid maps 0 to 0.5 exactly.
- Sigmoid maps 2 to 0.88 odds.
- Cut at 0.5 to call yes.
- Raise cutoff when false alarms hurt.
- Flat borders fail on ringed groups.