Environmental Impact of AI
Training a frontier model can draw power like a small factory and swallow millions of litres of cooling water. The footprint is energy times grid dirtiness, plus water.
Why Does This Exist?
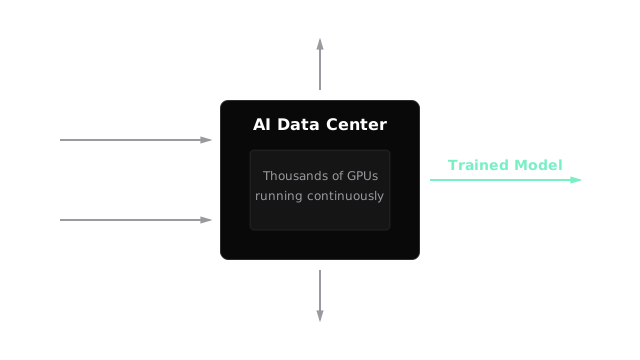
A training run that once fit on your desk now rents thousands of accelerators for months. The bill is not only money. It is megawatt-hours from the local grid and fresh water through the cooling towers, both drawn at industrial scale.
Teams feel this in three places: cloud invoices, corporate carbon reports, and permits for new data centers in dry regions. A model choice becomes a facilities choice. Fewer parameters, shorter runs, and cleaner grids all cut the same footprint from different sides.
This page covers where the footprint comes from and how to estimate it with four numbers. For the management system that tracks it alongside bias and safety, read responsible AI frameworks. For the rules that increasingly demand disclosure, read AI regulations. For how to publish the numbers honestly, read transparency and accountability.
Think of It Like This
Ten thousand kettles in one kitchen
Picture ten thousand electric kettles boiled nonstop for a month in one giant kitchen. The kettles are the GPUs. The power meter spins the whole time. The kitchen overheats, so you run fans and taps to keep it usable. The steam out the window is the waste heat.
Two details decide the damage. First, where the socket leads: coal power or hydro power. Same kettles, very different smoke. Second, how you cool: fans sip power while evaporative towers drink water. A dry town feels the second part first.
Where it stops: kettles leave you with hot water and nothing else. A training run leaves weights you reuse for years. The upfront boil can pay off if serving is efficient, which is why you must count inference too.
How It Actually Works
Call compute power in kilowatts, run time in hours, and compute energy in kilowatt-hours. Data centers add cooling and power overhead, measured by power usage effectiveness , which is total facility power divided by compute power. Facility energy is:
Carbon intensity is kilograms of per kilowatt-hour on the local grid. Total emissions are:
Water works the same way. Water usage effectiveness is litres per kilowatt-hour. Total water is .
Worked example with a 1,000 kW cluster
Run kW for hours, which is 30 days. Use , kg per kWh for a coal-heavy grid, and litres per kWh.
- Compute energy: kWh.
- Facility energy: kWh.
- Emissions: kg, which is 345.6 tonnes.
- Water: litres.
Move the same run to a hydro grid at and falls to kg. Same math, same model, one eighth the carbon. That is why location is a climate decision, not trivia.
Watch Out For
Counting training and forgetting serving
Symptom: the report celebrates a lean training run while the assistant answers millions of queries a day. Within months, inference energy passes training and nobody is metering it.
Fix: meter energy per thousand queries on your serving stack and multiply by traffic. If serving dominates, distill, quantize, cache, or route easy asks to a smaller model before you retrain the giant.
Reporting market offsets as zero smoke
Symptom: the dashboard reads net zero because certificates were bought, yet the meters still pulled coal power during the run. A local drought story then lands badly.
Fix: report location-based first, using the grid where the run happened, and list offsets separately. Plan water with the same honesty: litres withdrawn on site matter more than credits elsewhere.
The Quick Version
- The footprint is facility energy times grid intensity, plus cooling water.
- Facility energy is compute energy times PUE, as in 720,000 kWh times 1.2 equals 864,000 kWh.
- Our example emits 345,600 kg of CO2 at 0.4 kg per kWh and drinks 1,555,200 litres at 1.8 litres per kWh.
- The same run on a clean grid falls to 43,200 kg, so location decides carbon.
- Serving can pass training within months, so meter queries as well as runs.
- Report location-based emissions first and keep offsets in a separate line.