Explainable AI Methods
A loan model says no without saying why. Explainability methods split that no into per-feature credits, so you can see which input moved the score and by how much.
Why Does This Exist?
A model denies a loan and the applicant asks why. "The computer said no" ends the conversation and starts a complaint. Regulators, doctors, and judges hear the same silence everywhere black boxes decide.
Accuracy alone does not fix this. You need to know which inputs moved one decision and by how much, so you can debug the model, justify the call, or tell the person what to change. That is the whole job here: attach reasons to predictions without opening every weight.
This page covers post-hoc reasons for single predictions, the math that makes credits sum correctly, and where those reasons mislead. For how auditors use these reasons in practice, read model auditing. For how teams publish them, read transparency and accountability.
Think of It Like This
A food critic tasting one dish
You hand a chef three ingredients and get back a finished plate. You taste salt, richness, and heat but cannot tell what caused what. The kitchen keeps its recipe secret.
A critic tastes the same plate and reports back: the chili added the heat, the butter added the richness, the lime cut through both. The critic did not steal the recipe. They mapped each ingredient to its effect on this one plate.
An explainer is that critic for one prediction. Inputs are ingredients, the score is the dish, and each credit says how much one input pushed this decision. Where it stops: a critic can misread a dish, and an explainer can misread a model. The report describes the model faithfully only when the method fits the neighborhood around that input.
How It Actually Works
Call the model output for one applicant , call the average output for the base rate, and call each feature credit for feature . Additive methods promise:
In words: is where you start, each is how much feature pushed this applicant above or below that start, and the sum lands exactly on the model score. SHAP defines each as a Shapley value from game theory, which is the only split that satisfies local accuracy, missingness, and consistency together.
Worked example that sums to 0.60
Take a loan score with base rate . For one applicant the credits are income , debt , and age .
Add them in order:
So . The diagram draws this exact stack: a 0.40 base, a long positive block for income, a short negative block for debt, and a small positive block for age. Income tops the list, debt is the only drag, and the parts reconcile with the whole, which is the property auditors pay for.
Local lines and nearby flips
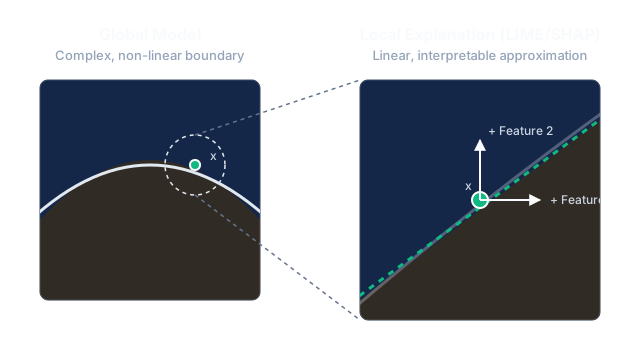
LIME answers the same ask differently. It samples near , weights near points more, and fits a short straight line through that neighborhood. The line slope is the local reason. It is fast and readable, but move the sampling width and the slope can move too.
Counterfactuals skip credit entirely and name the nearest input with a different verdict, such as income higher by a stated amount. That gives the applicant an action instead of a ledger.
Watch Out For
Reading a clean credit list as proof the model is right
Symptom: the credits sum neatly to 0.60 with income on top, so the denial looks justified. Nobody checks whether income itself encodes a proxy the model should not use.
Fix: treat credits as a description of the model, not a certificate for it. Cross-check the top features against proxy correlations and error rates per group before you quote the explanation to anyone affected.
Shipping a LIME chart that wobbles run to run
Symptom: the same applicant gets income on top on Monday and debt on top on Tuesday, with the prediction unchanged. The audit trail now contradicts itself.
Fix: fix the random seed, fix the sampling width, and rerun the explanation several times. If the ranking moves, widen the sample, stabilize the neighborhood, or switch the compliance case to exact additive credits.
The Quick Version
- Explainable AI attaches per-decision reasons to black box predictions.
- Additive credits start from a base rate and sum exactly to .
- Our example runs 0.40 plus 0.25 minus 0.10 plus 0.05 equals 0.60, with income on top.
- LIME fits a short local line through nearby samples for a fast readable reason.
- Counterfactuals name the nearest input that would flip the verdict.
- Credits describe what the model learned, including its biases, and never certify it.