Mean Average Precision
Mean Average Precision averages each class's precision-recall area across IoU thresholds, condensing a whole detector into the one number leaderboards quote.
Why Does This Exist?
Accuracy cannot score a detector: predictions are ranked boxes with confidences, not one label per image, and a box is only right relative to an IoU threshold. mAP handles all three dimensions at once. Per class, sort detections by confidence, walk down the list marking true and false positives at the IoU line, trace the precision-recall curve, and take its area: that is Average Precision. Average over classes for mAP. AP50 fixes IoU at 0.5; COCO-style AP averages ten thresholds from 0.5 to 0.95, rewarding tight boxes.
Think of It Like This
A hiring bar that weighs every rank
A hiring committee could count only top offers accepted, but that ignores the shortlist quality. Instead they score the full ranked list: how many of the top 10 were great, of the top 50, of everyone interviewed.
AP is that full-list score for one role. mAP averages it across every role hired. AP50 is the lenient committee, COCO AP the strict one checking every rank.
How It Actually Works
From detections to one number
Fix a class and IoU threshold 0.5. Sort its boxes by confidence. Walk down: each box matching an unmatched ground truth with IoU above 0.5 is a true positive, anything else a false positive. After each step compute precision and recall, plot the curve, and integrate. Repeat per class and average for [email protected]. Repeat at 0.55, 0.60 up to 0.95 and average those ten mAPs for COCO AP.
A small worked example
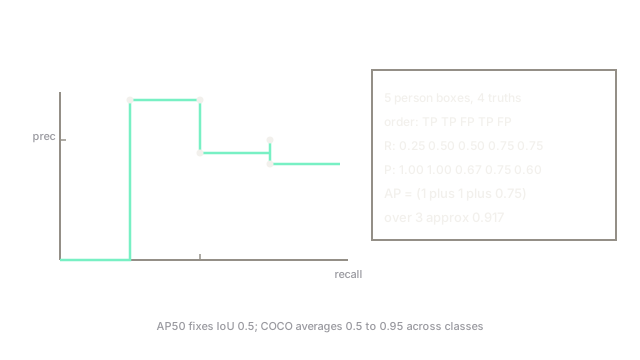
Five person detections sorted by confidence yield outcomes TP, TP, FP, TP, FP against 4 ground truths. After each step, recall is 0.25, 0.50, 0.50, 0.75, 0.75 and precision is 1.00, 1.00, 0.67, 0.75, 0.60. Averaging precision at the true-positive steps gives AP for the class. Real implementations use all-point interpolation, but the shape is this: rank quality times coverage.
Code
outcomes = [True, True, False, True, False] # TP/FP in confidence order
tp = fp = 0precisions = []for hit in outcomes: tp += hit fp += (not hit) if hit: precisions.append(tp / (tp + fp))
ap = sum(precisions) / len(precisions)print(round(ap, 3)) # -> 0.917Watch Out For
Quoting AP50 as detector quality
AP50 forgives sloppy boxes, so two models tied at 0.80 AP50 can differ wildly at strict thresholds. The symptom is a shipped model with visibly loose boxes. Quote COCO-style AP alongside AP50, and check AP for small objects separately.
mAP hiding a collapsed rare class
Averaging lets a frequent class carry the number while a rare one scores near zero. The symptom is a proud mAP beside a blind spot on the class that motivated the project. Always read per-class AP before averaging, and weight what matters.
The Quick Version
- AP is the area under one class's precision-recall curve at an IoU threshold.
- mAP averages AP across classes; AP50 uses IoU 0.5, COCO AP averages 0.5 to 0.95.
- Strict thresholds reward tight boxes; loose ones flatter sloppy detectors.
- Per-class AP reveals collapsed rare classes that the mean hides.