Time Series Anomaly Detection
Finding specific data points in a timeline that severely violate expected patterns, usually indicating a system failure, a fraudulent transaction, or a sensor malfunction.
Why Does This Exist?
In traditional data science, finding an anomaly is easy: if everyone in the database is between 5 and 6 feet tall, and one person is 12 feet tall, they are an anomaly.
In a time series, it is much harder. If an e-commerce website gets 10,000 visitors at 2:00 PM on a Tuesday, that might be perfectly normal. If they get 10,000 visitors at 2:00 AM on a Sunday, that might be a massive anomaly indicating a bot attack. The absolute number (10,000) is not anomalous. The context (time of day and day of week) makes it anomalous.
Time series anomaly detection algorithms are designed to understand the expected context (trends and seasons) so they can flag points that violate that specific context.
Think of It Like This
Think of It Like This
Imagine you are monitoring a patient's heart rate.
A heart rate of 150 BPM is very high. Is it an anomaly? If the patient is sprinting on a treadmill (the context/trend), 150 BPM is perfectly normal. If the patient is asleep in bed (the context/seasonality), 150 BPM is a life-threatening anomaly.
Time series anomaly detection first models what the patient is currently doing, and then decides if the heart rate is abnormal.
How It Actually Works
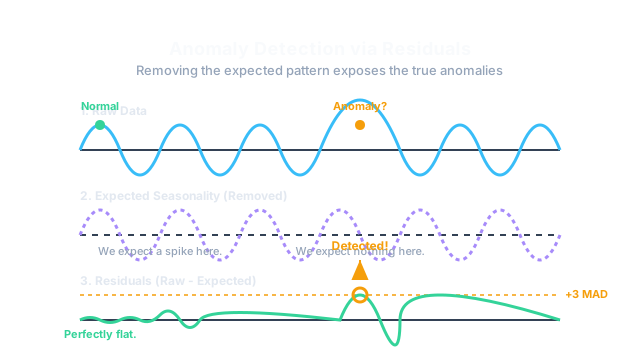
Because you cannot just look for "big numbers", the standard approach involves Time Series Decomposition.
Step 1: Remove the Structure
You decompose the time series to extract the Trend and the Seasonality, and you subtract them from the raw data. What you are left with is the Residual (the pure noise).
Step 2: Look for Spikes in the Noise
By definition, the Residual should hover around zero. If the raw data spikes at 2:00 PM, and that spike is fully explained by the Seasonality (because it always spikes at 2:00 PM), the Residual stays at zero. However, if the data spikes at 2:00 AM (when it shouldn't), the Seasonality won't subtract it. The Residual will show a massive spike.
Step 3: Set a Threshold
Now that you have a flat line of noise with occasional spikes, you apply a mathematical threshold to flag the anomalies.
- Z-Score: Flags any point that is 3 standard deviations away from the mean. (Only works if the noise is normally distributed).
- MAD (Median Absolute Deviation): A much more robust version of the Z-Score that isn't easily distorted by massive outliers.
- Isolation Forests: A machine learning algorithm that tries to isolate data points. If a point is very easy to isolate from the rest of the herd using a few decision trees, it is flagged as an anomaly.
Code
You can implement robust anomaly detection using basic pandas and statsmodels.
import pandas as pdimport numpy as npfrom statsmodels.tsa.seasonal import STL
# Assume 'df' contains daily website traffic for 2 years# 1. Decompose the series using STLstl = STL(df['traffic'], period=7) # Weekly seasonalityresult = stl.fit()
# 2. Extract the residuals (the noise)residuals = result.resid
# 3. Calculate the robust MAD (Median Absolute Deviation) thresholdmedian = residuals.median()mad = np.median(np.abs(residuals - median))
# 4. Define an anomaly as anything further than 3 MADs from the medianthreshold_upper = median + (3 * mad)threshold_lower = median - (3 * mad)
# 5. Flag the anomaliesanomalies = df[ (residuals > threshold_upper) | (residuals < threshold_lower)]
print(f"Found {len(anomalies)} anomalies!")Watch Out For
Anomalies ruin models.
If you are building a forecasting model, you must remove anomalies before you train. If your historical data contains a massive spike because your website crashed for a day, an ARIMA model will assume that crash is a normal part of your business cycle and will try to forecast future crashes. You must interpolate or smooth over anomalies before forecasting.
The Quick Version
- A number that is normal at 2:00 PM might be a massive anomaly at 2:00 AM.
- To detect anomalies, you must first remove the expected Trend and Seasonality.
- You run statistical tests (like MAD or Z-Scores) on the leftover Residuals (the noise).
- Anomalies must be cleaned or removed before training a forecasting model, or the model will learn to predict the anomalies.