Functions of Several Variables
A recipe with several ingredients: the output depends on all of them at once, and level curves show every combination that tastes exactly the same.
Why Does This Exist?
Every loss is a function of several variables. It eats the whole parameter vector and returns one number. Before you can differentiate it, optimize it, or constrain it, you need to picture what such a function even is: where it lives, what its output means, and how to hold one input still while another moves.
The payoff is a mental image you will reuse everywhere. A loss landscape is a level surface of a function of millions of variables. A decision boundary is a level curve of a classifier's score. Contour plots of two hyperparameters are level curves you can literally see. This page builds that image in two dimensions, where it can be drawn.
The one idea you need first
A single-variable function pairs each input with one output , drawn as a curve. A function of two variables pairs each point with one output , drawn as a surface floating over the plane. Fix the output to a constant and look at all inputs producing it: that set is a level curve , the contour lines on a hiking map. Everything here is contour reading plus one-axis slopes, and the slopes are partial derivatives.
Think of It Like This
A recipe with two ingredients
Flavour depends on sugar and salt together. Add sugar holding salt fixed and it sweetens; add salt holding sugar fixed and it sharpens. Either ingredient alone tells you nothing about the dish.
Now draw every sugar-salt pair that tastes exactly equally good and you get a curve through recipe space: the level curve of flavour. Move along it and the taste never changes, even though both ingredients do. Step off it and flavour rises or falls. A loss landscape works the same way, except the ingredients are millions of weights and the flavour is the error. The contour map is the only picture that fits on a page, which is why this site draws landscapes as contours rather than surfaces.
The analogy stops at interaction. In cooking you can reason about sugar and salt separately and mostly survive. In a network the variables interact so strongly that one-at-a-time reasoning misleads, and that interaction is what gradients and Hessians are for.
How It Actually Works
A scalar-valued function of two variables is a rule assigning one number to each point of some region (its domain). Three views of the same object:
- The surface : height over the plane. Intuitive, but impossible past three dimensions.
- The level curves : one curve per output value. This view survives into high dimensions as an idea, and it is what the diagram draws.
- The partial readings and : the slope along each axis with the other frozen. Together they form the gradient, the compass of the surface.
Close to any point, the function is nearly flat in the precise sense of the linear estimate:
In plain words: the change is each partial times its step, added. Every optimizer step is this estimate in action, trusting the flat approximation for one small move.
Worked example
Take at the point .
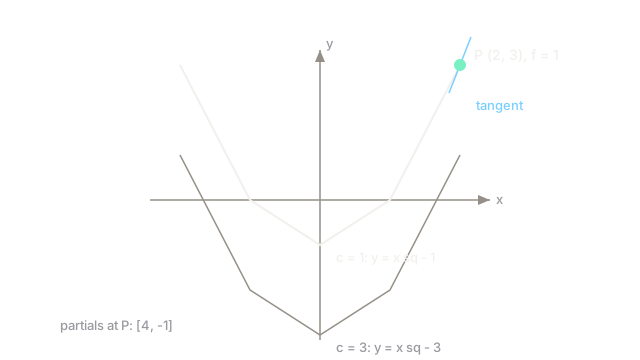
The value is , so this point sits on the level curve , which rearranges to the parabola . Check: at , . Correct.
The partials: and . Now step to , so and . The linear estimate predicts . The exact value is . Off by one hundredth, which is the estimate earning its keep.
Watch Out For
Assuming variables act independently because partials exist
Each partial freezes the other variables, which is a laboratory condition, not reality. In a model the inputs to a function are usually computed from shared upstream parameters, so they move together. Conclusions drawn one variable at a time, like tuning two hyperparameters on separate one-dimensional grids, miss the interaction and land somewhere neither line suggested. Read partials as ingredients of the gradient, never as standalone verdicts.
Confusing the level curve with the graph
The parabola in the diagram is not the function. It is one contour: every point on it outputs 1. The function itself is the whole stack of contours, one per value. Newcomers sometimes point at a single contour and reason about it as if it were the surface, then wonder why moving along it changes nothing. Moving along a level curve changes nothing by construction; the action is perpendicular to it.
The Quick Version
- A function of several variables maps each input combination to one output; a loss maps the whole parameter vector to one error.
- Level curves collect every input giving the same output, like contours on a hiking map.
- Partials measure the slope along one axis with the rest frozen; together they form the gradient.
- Near any point the function is nearly linear, and the linear estimate predicts small moves well.
- Contours are pictures of the function, not the function; the action runs across them, not along them.