Inclusive ML
Standard training chases the average, so the majority wins by default. Inclusive ML designs the data and the checks so smaller groups get a model that works for them too.
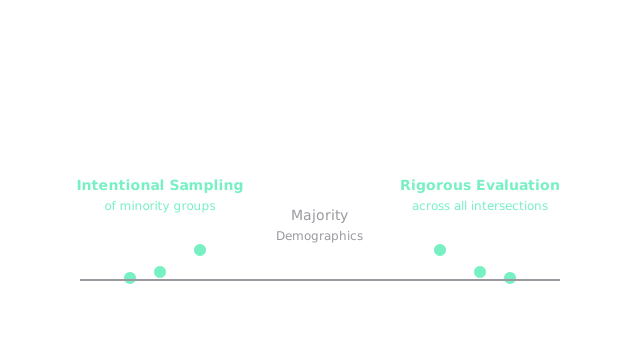
Why Does This Exist?
Train a voice assistant on mostly North American male voices and it will transcribe that group beautifully while failing women and accented speakers daily. Nothing went wrong in the optimizer. It did exactly what it was told: minimize total error. The majority contributed most of the examples, so errors on the majority dominated the loss, and the model spent its capacity there.
That is the default state of machine learning, and it is not neutral. A single overall accuracy number then hides the damage. A model at 93 percent overall can be 98 percent for 900 majority users and 48 percent for 100 minority users, and the headline still reads 93 percent. Nobody looking at the headline would know half of one community cannot use the product.
Inclusive ML is the deliberate countermeasure. It changes what data gets collected, how errors get weighted, and above all how success gets measured, so underrepresented groups are served on purpose instead of by luck.
This page covers the three interventions: representation, training weights, and split evaluation. For what fairness means and which definition you are enforcing, start with AI fairness. For where bias creeps in, read algorithmic bias. For who needs a seat at the design table, stakeholder engagement is the sequel.
Think of It Like This
A school bus route drawn from trip counts alone
A district plans bus routes by total ridership. One dense neighbourhood holds 900 kids and one valley holds 100, so every bus goes to the dense neighbourhood and the valley gets none. Average walking distance looks great on paper. The valley kids still walk along a highway.
Inclusive planning redraws the map with one rule change: every neighbourhood gets measured separately, and no route ships while any single neighbourhood walks the highway. The dense area keeps most of its buses but gives up one, and the valley gets a working route. The average barely moves. The worst case transforms.
The mapping holds point for point. Riders are training examples, buses are model capacity, walking distance is error rate, and the per-neighbourhood report is disaggregated evaluation. The cost is real too: the dense area waits just a little longer, the way a majority group can lose a point or two.
Where it stops: a bus route either serves a street or it does not, while model quality is a spectrum. Splitting the scoreboard does not itself fix the model. Someone still has to collect the valley data and retrain.
How It Actually Works
Call each demographic slice a group , with the majority and the minority. Write and for accuracy inside each group and for overall accuracy. Standard training maximizes and reports . Inclusive ML reports and separately and ships only when both clear the bar.
Representation first
Most fairness failures start as sampling failures. If is 10 percent of training data, the model sees few of its patterns and the eval slice is too small to trust. The fix is deliberate collection: sample more speakers from underrepresented accents, more skin tones under varied lighting, more dialects in text. Oversampling means drawing extra copies or extra fresh examples from until its slice is dense enough to learn and to measure. Synthetic augmentation can help, but it cannot invent variation the team never observed, so real collection comes first.
Weight the loss
Even balanced data can lose to an unbalanced objective. Cost-sensitive learning multiplies errors on by a weight , so a miss on the minority costs the optimizer more than a miss on the majority. With , one minority error pulls as hard as three majority errors, and the boundary shifts to protect the smaller group. Adversarial debiasing pushes further: a second head tries to guess the sensitive attribute from the model's internals, and the main model is penalized whenever that guess succeeds, which squeezes out encodings of the attribute itself.
Worked example: 93.0 percent hides 48 percent
Take 1,000 users: 900 in , 100 in . A standard model gets 882 of the 900 right and 48 of the 100 right.
Accuracy in is , or 98 percent. Accuracy in is , or 48 percent. Overall is , or 93.0 percent. The gap between groups is points, and the minority error rate is percent. The headline says 93. The valley walks the highway.
Now retrain inclusively with oversampled data and minority errors weighted triple. The new model gets 855 of 900 in and 90 of 100 in . That is (95 percent) and (90 percent), with overall (94.5 percent). The gap collapses from 50 points to points. The minority gains points, the majority pays points, and the average itself rises by points because the minority gain outweighs the majority cost. That is the diagram above: two bars per panel, same thousand users, completely different worst case.
Monitor after launch
Populations drift and feedback loops bite. A model that was fair in March can be unfair by September as new users arrive or its own outputs become tomorrow's training data. Ship a dashboard that recomputes and on fresh traffic every week, with an alert when the gap crosses an agreed threshold, plus a reporting channel so affected users can flag failures the slices miss. Model auditing turns this into a formal gate.
Code
Split the scoreboard in plain Python. The function below takes correct and total counts per group and returns each rate plus the worst gap, which is the number the headline hides.
def disaggregated_report(correct: dict[str, int], total: dict[str, int]) -> dict[str, float]: """Per-group accuracy plus the worst gap between any two groups.""" rates: dict[str, float] = {g: correct[g] / total[g] for g in correct} worst_gap: float = max(rates.values()) - min(rates.values()) return {"majority_rate": rates["majority"], "minority_rate": rates["minority"], "worst_gap": worst_gap}
std = disaggregated_report({"majority": 882, "minority": 48}, {"majority": 900, "minority": 100})print(f"{std['majority_rate']:.2f} {std['minority_rate']:.2f} {std['worst_gap']:.2f}") # -> 0.98 0.48 0.50
inc = disaggregated_report({"majority": 855, "minority": 90}, {"majority": 900, "minority": 100})print(f"{inc['majority_rate']:.2f} {inc['minority_rate']:.2f} {inc['worst_gap']:.2f}") # -> 0.95 0.90 0.05The printouts match the hand arithmetic: a 50 point gap before, a 5 point gap after. Wire this into evaluation so no model ships on its average alone.
Watch Out For
Fairness on one axis hides the intersection
The dashboard shows gender parity and racial parity separately, both within 2 points, so the team ships. Then someone slices by both at once and finds one intersectional group 30 points behind. Single-axis checks average over the very people most at risk.
Symptom: every published slice looks fine while complaints cluster in a group you never named. Fix: evaluate intersections with enough samples to trust, at least gender by age band or the two most relevant attributes for your product, before launch. If a cell is too small to measure, say so in the release notes instead of implying it passed.
Needing sensitive data to prove fairness
You cannot compute without knowing who is in , but collecting that attribute creates its own privacy and legal risk, and users may refuse to provide it. Teams sometimes resolve this by never measuring, which quietly reinstates the 48 percent failure.
Symptom: the fairness dashboard stays empty quarter after quarter while the model serves everyone. Fix: collect attributes with explicit consent for evaluation only, store them apart from training features, aggregate before sharing, and consider privacy-preserving measurement so the audit does not become a surveillance file. Pair this with consent and data rights before you ask anyone for anything.
The Quick Version
- Optimizing one average serves the majority by default, because most training examples come from there.
- A 93.0 percent headline hid a 48 percent minority slice in our worked example of 1,000 users.
- Inclusive ML oversamples underrepresented groups, weights their errors higher, and grades every group separately.
- The inclusive retrain moved the minority from 48 to 90 percent at a cost of 3 points on the majority, closing a 50 point gap to 5.
- Single-axis parity can still hide intersectional failures, so slice by combined attributes too.
- Fairness needs sensitive attributes to measure, which demands consent, separation, and honest handling.