Fairness and Bias in Vision
A face model can score 0.94 overall while failing one group at 0.71. Slice metrics reveal the gap that a single accuracy number hides.
Why Does This Exist?
Vision datasets overrepresent some people, lighting, and places while barely covering others. Models trained on them learn the majority slice best, and a single headline accuracy lets the minority failure hide inside the average.
Fairness work in vision makes the slices explicit before any fix: who is in the data at what share, where accuracy drops, and whether errors concentrate as false matches or false rejections. The condition that flips the approach is the cause: representation gaps need data and sampling fixes, while annotation and threshold gaps need labeling and decision fixes. General fairness background is not repeated here; this page covers the vision slice audit.
Think of It Like This
A school exam graded on one curve
A teacher writes examples from one neighborhood's streets, then grades every student on a single curve. The class average looks fine while students from unrepresented neighborhoods fail the same three questions. The fix is not a gentler curve but new questions plus per-group score reports.
Vision audits do the same. The headline number is the class average. Slice metrics are the per-group reports. The analogy stops at remediation: reweighting a loss can move a model number, while no grading trick teaches unasked material, so missing data still needs collecting.
How It Actually Works
Define slices before training from documented attributes (lighting, pose, group labels where consented and lawful), and fix minimum slice sizes so estimates are stable. Evaluate accuracy, false-match, and false-reject rates per slice beside the headline. The audit's output is the worst-slice gap and its error pattern, not a blended score.
Worked example
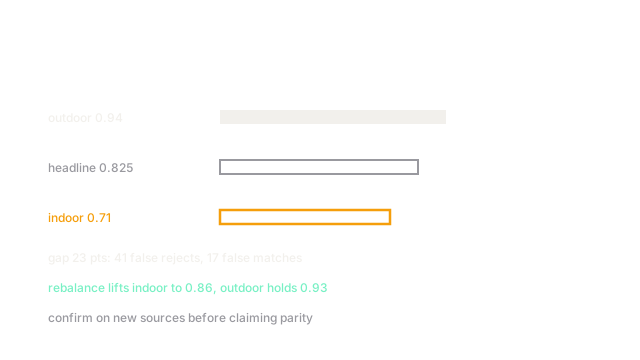
A demo face-verification audit covers 400 pairs: 200 bright outdoor and 200 darker indoor portraits. Accuracy reads 0.94 outdoors (188 of 200) and 0.71 indoors (142 of 200), a 23-point gap hiding inside a 0.825 headline. Indoor errors split into 41 false rejections and 17 false matches, so the failure is missed identity, not confusion. Collecting 150 more indoor pairs and rebalancing batches lifts indoor accuracy to 0.86 while outdoor holds 0.93. The slice table, not the headline, proves the fix.
Watch Out For
Fixing the metric instead of the data
Tuning thresholds per slice can equalize a dashboard while the underlying representations stay weak. The symptom is parity on one benchmark that evaporates on the next camera. Confirm with held-out slices from new sources before claiming a fairness win.
The Quick Version
- Headline accuracy hides slice failures; the audit reports per-slice rates.
- On the demo audit outdoor accuracy is 0.94 and indoor is 0.71, mostly false rejections.
- Representation gaps need data fixes; threshold gaps need decision fixes.
- Rebalancing lifts the weak slice to 0.86 while the strong slice holds.
- Never claim fairness from a blended score or a single benchmark.