Inference Optimization Vision
Training chases accuracy once, but inference pays per image, so optimization trims math and memory to hit frame budgets.
Why Does This Exist?
A detector that trains in a day must then run 30 times per second for years on a store camera. Naive PyTorch at 120 ms per frame misses the 33 ms budget for 30 fps. Inference optimization exists to close that gap: fuse ops, quantize, batch, and pick a runtime. Model serving deploys the result. This page is the vision recipe before runtime choice.
Runtime pages follow. ONNX exchanges graphs. TensorRT and OpenVINO compile them. Batching and fusion are the two biggest levers here.
Basics first: latency is time per image. Throughput is images per second. Batching raises throughput but can raise latency. Frame budget picks which matters.
Think of It Like This
A food truck at lunch rush
A truck that cooks one burger at a time serves 55 an hour with fresh buns. Batching four patties, fusing grill and toast steps, and pre mixing sauce serves 320. Some orders wait longer, but the line moves. Latency is one order wait. Throughput is fed crowd. The analogy stops at quality: burgers batch evenly, while vision batches stall on odd sizes unless padded.
How It Actually Works
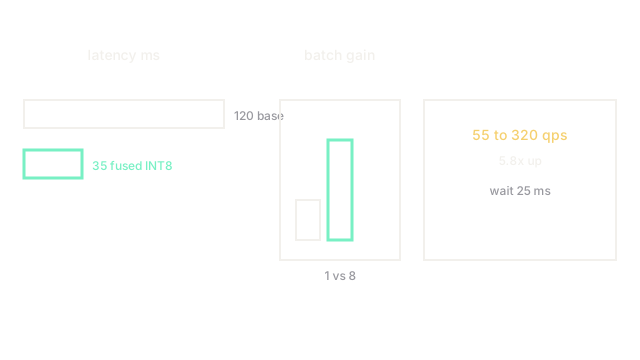
Profile first on target: 120 ms splits into 45 ms convolutions, 30 ms memory moves, 25 ms NMS, 20 ms Python overhead. Fuse Conv plus BatchNorm plus ReLU into one kernel to remove 18 ms of moves. Quantize to INT8 for 2.1 times math speed on supporting cores. Move NMS to device and batch 8 to amortize launch. Compile with a runtime to remove Python gaps.
Input shapes are the contract. Fix height and width at export, pad odd sizes, and keep batch multiples of 8 for tensor cores. Dynamic shapes cost 15 percent unless the runtime builds explicit profiles.
Worked budget math
Baseline 120 ms is 8.3 fps since 1000 divided by 120 equals 8.33. After fusion plus INT8, 35 ms is 28.6 fps since 1000 divided by 35 equals 28.57. Batch 8 at 25 ms per batch holds 320 per second since 8 divided by 0.025 equals 320, against single stream 28.6, a 11.2 times throughput gain for 25 ms batch latency.
Watch Out For
Lab GPU numbers that vanish on cameras
An A100 shows 35 ms while a 15 watt edge chip shows 210 ms on the same graph. The symptom is green lab reports with field misses. Fix it by profiling on the deployment chip from day one and by locking clocks during measurement.
The Quick Version
- Inference optimization trades one time training ease for per image cost.
- Fuse ops, quantize, batch, then compile for the chip.
- Our detector fell 120 ms to 35 ms, 8.3 to 28.6 fps.
- Batch 8 reached 320 per second at 25 ms batch wait.
- Profile on target silicon or lab gains mislead.