Multispectral Imaging
RGB samples three broad colors; crops, minerals, and camouflage hide between them. Multispectral cameras add narrow bands that make chlorophyll, moisture, and paint pop apart.
Why Does This Exist?
Broadband RGB suffers metamerism: different spectra, same color. Stressed and healthy crops look alike in green; camouflage matches foliage in RGB while differing sharply in near-infrared; mineral veins hide in averaged bands. Eyes and RGB agree — and both miss what narrow bands reveal.
Multispectral cameras sample – narrow bands (red edge, near-infrared) where chemistry writes signatures: chlorophyll reflects NIR strongly and absorbs red, water darkens shortwave bands, paints diverge outside the visible. Agriculture, forestry, and inspection run on these gaps. The heat-sensing sibling is thermal imaging; the map is alternative sensing.
The one idea you need first. The NDVI (normalized difference vegetation index) is band arithmetic, not magic: . Healthy leaves (high NIR, low red) score near –; bare soil hovers near ; water goes negative. Ratios cancel illumination swings that corrupt single bands.
Think of It Like This
Tasting with eight spoons instead of three
Three spoons (sweet, salty, sour) judge every soup the same few ways: two broths can taste identical on all three while differing in an herb none detects. Eight spoons add bitter, umami, and three spice-specific ones — suddenly the recipes separate and the missing ingredient names itself.
RGB is three spoons. Multispectral adds red-edge and NIR spoons tuned to chlorophyll and water. Stressed crops "taste" different in NIR long before yellowing reaches RGB, which is why agronomists irrigate off band math while neighbors wait for visible wilt.
How It Actually Works
Bandpass filters (or multisensor arrays) capture aligned narrowband frames; radiometric calibration converts counts to reflectance using a reference panel photographed under the same light. Indices combine bands per pixel (NDVI for vigor, NDRE with red-edge for late-season nitrogen, NDWI for water), and maps aggregate indices into management zones. Drones add orthomosaicing; satellites add atmospheric correction. Hyperspectral (hundreds of bands) extends the same idea with heavier data and finer chemistry.
Band choice follows the target's spectrum: chlorophyll's red-edge jump near nm sets the classic pair.
Worked example
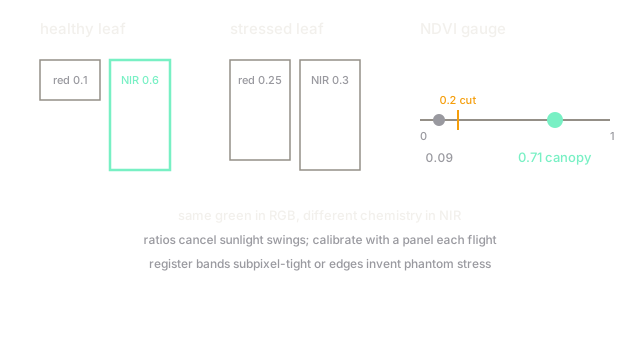
Healthy leaf: NIR reflectance , red . NDVI . Stressed leaf: NIR , red . NDVI .
Threshold separates the field: above it, photosynthesizing canopy; below, stress, soil, or senescence. A whole farm maps from two bands and one division per pixel — the cheapest remote diagnosis in agriculture.
Code
The point of this snippet is the index: two bands and a division reproduce the versus split.
def ndvi(nir: float, red: float) -> float: return (nir - red) / (nir + red) # normalized: light-invariant
print(round(ndvi(0.6, 0.1), 3)) # -> 0.714print(round(ndvi(0.3, 0.25), 3)) # -> 0.091Watch Out For
Sunlight changes the answer without touching the field
Clouds, sun angle, and haze shift band values between flights; uncalibrated NDVI drifts with weather rather than crops. Comparing Tuesday's raw map to Friday's raw map measures meteorology.
Photograph a calibrated reflectance panel each flight and convert to reflectance before indexing. Timestamp and solar angle ride along in metadata, or the time series is fiction.
Bands that misalign on moving platforms
Multisensor arrays expose bands milliseconds apart; on a fast drone that gap shifts footprints by whole pixels. Index math on misregistered bands invents edges at every boundary — phantom stress rows along tractor lines.
Register bands with subpixel alignment (or use single-sensor snapshot mosaics) and check index maps against RGB edges. Fringing at boundaries is registration error wearing a diagnosis costume.
The Quick Version
- Multispectral cameras add narrow bands where chemistry (chlorophyll, water) writes signatures RGB averages away.
- NDVI maps vigor per pixel from two bands.
- The worked fixture gives healthy versus stressed, split by a threshold.
- Calibrate every flight with a reference panel or weather corrupts the time series.
- Register bands subpixel-tight on drones or edges invent phantom stress.