K-Means
Point every observation at its nearest centre, move each centre to the mean of its points, repeat. It always settles, and not always in the right place.
Why Does This Exist?
A garden centre has 30,000 loyalty cards and six end-of-aisle display slots. Nobody ever wrote down what kind of shopper each card belongs to. All you have is two columns per card: last year's spend, and how many times they walked in.
You want groups the receipts already contain, not groups you defined in advance. K-means is the oldest tool that still does that well enough to be everywhere.
Two words first. A distance is a number saying how far apart two shoppers are once you've written them down as coordinates (the options). A centroid is a group's average, column by column — a made-up shopper at the middle of a real crowd.
Think of It Like This
Six ice-cream vans and a long beach
Six vans park on the sand in the morning, wherever they happened to arrive. Every sunbather walks to the nearest van. Each driver then moves to the middle of the queue they got.
Which changes everything. Some sunbathers are now nearer a different van, so they switch, and the drivers reposition again. A few rounds later it stops: nobody switches, nobody moves. The beach is carved into six territories.
Here's the part that stings. Park the vans differently tomorrow and they settle somewhere else entirely — also stable, sometimes visibly worse. Stable does not mean best.
Notice what the vans assume, too. "Nearest" carves sand into round-ish patches, so nobody in this picture can serve a long thin strip along the water's edge.
How It Actually Works
The two steps, and the number they drive down
Pick k centroids somehow. Then repeat two steps until nothing changes: assign every shopper to their nearest centroid, then move every centroid to the mean of its shoppers. That's Lloyd's algorithm, and it's the whole method.
What it minimises is the within-cluster sum of squares — every shopper's squared distance to their own centroid, added up:
is the set of shoppers in cluster , is that cluster's centroid, and the double bars mean straight-line distance. Both steps lower that total or leave it alone: moving a point to a nearer centroid can't raise it, and the mean is provably the point that minimises summed squared distance to a set. A quantity that only falls, over finitely many possible assignments, has to stop falling. So k-means always converges.
To a local minimum. That's the catch the vans showed you. Where it lands depends on where it started, which is why nobody runs it once — run it ten times from different starts and keep the lowest total.
Where you start decides where you land
Random starts fail in a specific way: two centroids land inside the same real group and split it down the middle, while a genuinely separate group gets absorbed into a neighbour. Restarts help, but you're paying for luck.
k-means++ buys the luck instead. Take the first centroid at random. For each later one, measure every shopper's squared distance to the nearest centroid chosen so far, and draw the next with probability proportional to that. Far-away shoppers become likely; shoppers already beside a centroid become nearly impossible. It's the library default: faster convergence, lower landing, almost every time.
Choosing k, and the shape it assumes
The elbow method plots the within-cluster sum of squares against k and tells you to find the bend. Sometimes there's a bend. Often the curve is a smooth arc and three people read three different values off it, because there is no elbow. Silhouette is a better instrument and still a heuristic.
In practice the answer comes from outside the data. The garden centre has six display slots, so k is six. Six segments you can act on beats five because a curve looked slightly bent.
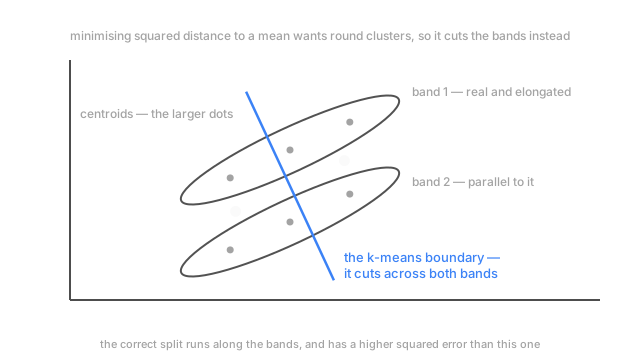
Then the assumption that decides where the method fails. Minimising squared distance to a mean expects clusters roughly round, roughly equal in size, roughly equal in density. Feed it two long parallel bands — landscapers whose spend climbs steeply per visit, home gardeners whose spend climbs gently — and it slices both bands across the middle, because that split has lower squared error than the correct one. The diagram is that failure.
Code
Lloyd's algorithm in six lines, run on those two bands.
import numpy as np
def lloyd(X: np.ndarray, k: int, seed: int) -> float: rng = np.random.default_rng(seed) C = X[rng.choice(len(X), k, replace=False)] # plain random seeding, not k-means++ for _ in range(60): lab = ((X[:, None] - C) ** 2).sum(-1).argmin(1) # an empty cluster would average nothing, so its centroid stays put C = np.array([X[lab == j].mean(0) if (lab == j).any() else C[j] for j in range(k)]) return float(((X - C[lab]) ** 2).sum())
rng = np.random.default_rng(0)t = rng.uniform(0.0, 10.0, 300)X = np.column_stack([t, 0.35 * t + np.where(rng.random(300) < 0.5, 0.0, 3.0)]) # two bandsfor k in (1, 2, 4, 8): print(f"k={k} best-of-5 inertia {min(lloyd(X, k, s) for s in range(5)):8.1f}") # -> k=1 best-of-5 inertia 3635.1 # -> k=2 best-of-5 inertia 1386.3 # -> k=4 best-of-5 inertia 647.0 # -> k=8 best-of-5 inertia 181.9Two real groups in that data, and the objective keeps falling anyway. Nothing in the number knows when to stop.
Watch Out For
Clustering columns that were never on the same scale
Annual spend runs from 20 to 4,000. Visit count runs from 1 to 40. Square both and spend contributes roughly ten thousand times more to every distance, so "nearest centroid" means "nearest in spend" and nothing else. The symptom is obvious once you look: your clusters are clean spend bands, the boundaries sit near the quartiles, and visit count has almost the same mean in every one.
Standardise first — subtract the mean, divide by the standard deviation, per column — then refit. Feature scaling covers when to use something else. This is not a tuning detail; it decides who lands where.
Treating a low objective as evidence the clusters are real
Someone reports 181 at k=8 against 1386 at k=2 and concludes eight segments fit better. The code shows why that's empty: the total falls every time you add a centroid, and it hits exactly zero when k equals the number of shoppers and each one is its own cluster.
It measures how tightly points sit around their centres, and adding centres always tightens that. It can't tell you a cluster is real or that k is wrong. For that you need something that also penalises spreading out — a silhouette score, a stability check across resamples, or evidence the groups differ on a column you kept out of the clustering.
The Quick Version
- Assign to nearest centroid, move each centroid to its mean, repeat. That's Lloyd's algorithm.
- It minimises total within-cluster squared distance. That total never rises, so it always converges — to a local minimum set by the starting centroids.
- Restart it, or seed with k-means++, which picks starting centroids far apart with probability proportional to squared distance.
- Scale your columns first. Unscaled, the widest column decides everything.
- The elbow often has no elbow. A constraint on k from outside the data usually beats a curve.
- Squared distance to a mean assumes round, similar-sized, similar-density clusters. Elongated groups get cut across, not separated.