Multiple Hypothesis Testing
One test at 5% fails 5% of the time. A thousand tests at 5% each fail about fifty times. Family-wise and FDR rules reset the bar for crowds.
Why Does This Exist?
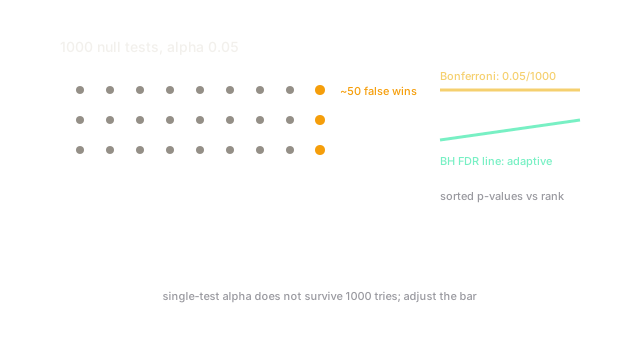
Feature screens, prompt sweeps, and leaderboard climbs test hundreds of ideas and report the winner. At 5% each, 1,000 pure-noise ideas produce about 50 "significant" winners. Publishing the best without the denominator is selection bias with a p-value costume.
Two fixes cover two goals. Bonferroni controls the family-wise chance of any false win at by testing each at . Benjamini-Hochberg (BH) controls the fraction of false wins (FDR) at by ranking p-values against . It extends hypothesis testing to the bulk regime where question count dominates.
The one idea you need first
A p-value is uniform under the null: 5% fall below 0.05 by construction. Multiply by tests and the expected false count is . The fix moves the bar, not the data.
Think of It Like This
Security lines for a stadium
One gate with a 5% false-alarm rate inconveniences a few fans. A thousand gates at the same rate stop hundreds of innocent fans while the announcer celebrates each catch.
Bonferroni searches every fan thoroughly: slow, almost no false stops. FDR accepts that 10% of stops are wrong but keeps the flow moving. Where it stops: stadiums control physical queues, while tests correlate through shared data, which bends both guarantees.
How It Actually Works
Bonferroni: reject . With , , the bar is : expected false wins . BH at level : sort , find largest with , reject the first . At with 40 rejections, expect at most 4 false. Holm steps Bonferroni down for extra power; Storey estimates the null proportion for more.
Worked example
Thousand nulls, : expect false wins, . Certain embarrassment. Bonferroni at cuts expectation to . BH example with sorted p-values at , : cutoffs . Only passes (), so reject one. The runner-up fails : close is not enough.
Code
import numpy as np
rng = np.random.default_rng(10)pvals = rng.random(1000) # all null, uniformprint(int((pvals < 0.05).sum())) # -> ~50print(int((pvals < 0.05 / 1000).sum())) # -> 0Null uniforms trip the single bar about 50 times and the Bonferroni bar zero. The denominator decides the headline.
Watch Out For
Reporting the winner without the sweep size
"Best of 500 prompts gains 3 points, p = 0.01" hides 499 losers. Unadjusted, that p-value is one of 500 draws, and a 0.01 best is expected under pure noise. Leaderboards and ab-test peeking run on this fuel.
Log and report : every prompt, seed, and checkpoint tested. Adjust or hold out fresh data for the winner. No denominator, no claim.
Reading FDR as per-discovery certainty
FDR means about 10% of rejections are false on average, not that each rejection is 90% true. With 5 rejections, one false is normal, and which one is unknown.
Follow up rejections with validation. If each discovery triggers spend, tighten or confirm independently.
The Quick Version
- Single-test 5% on 1,000 nulls yields about 50 false wins and near-certain embarrassment.
- Bonferroni tests each at ; at 1000 the bar is 0.00005.
- BH ranks p-values against and caps the false share of wins.
- Example rejects one of four candidates at ; near-misses still fail.
- Always report the sweep size ; unadjusted best-of-sweep p-values are fiction.
- FDR controls the batch fraction, not each discovery's truth.