Feature Engineering for Time Series
Tree models cannot see order on their own. Lags, rolling summaries, and calendar codes turn recent history into plain columns they can read.
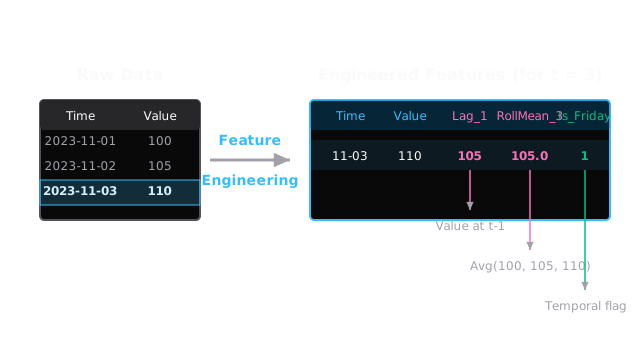
Why Does This Exist?
Tree models such as random forests and gradient boosting read rows as independent. Give them a timestamp and a target and they learn a map from date text to numbers, with no sense that yesterday shapes today. They miss momentum, weekly rhythm, and holiday spikes because none of those appear as a column.
Feature engineering translates time into columns. Lags copy specific past values forward, rolling windows summarize recent momentum and volatility, and calendar codes name the position in the week or year. With those columns, a fast interpretable tree can beat far heavier sequence models on standard forecasting tables.
This page covers building those columns without leaking the future. Splitting the resulting rows honestly belongs to cross-validation. Separating trend from season before choosing lags belongs to time-series decomposition. Flagging what the model still misses belongs to anomaly detection.
Basics first: autocorrelation, meaning correlation of a series with its own past, tells you which lags matter. A strong lag 7 means last week predicts this week, so that lag earns a column.
Think of It Like This
Driving with a dashboard
Driving while staring only at the road under the bumper gives no context. Feature engineering builds the dashboard.
Lag features are the rearview mirror: what the road looked like one second and seven seconds ago. Rolling features are the speedometer and the bumpiness gauge: average pace and volatility over the last minute. Calendar features are the clock and calendar: Friday rush hour behaves like Friday, not like Tuesday dawn.
Where it stops: dashboard gauges read the present and past only. A gauge wired to a future sensor, such as a centered average that includes tomorrow, looks helpful in the garage and fails on the road because tomorrow has not happened yet.
How It Actually Works
Call the target at time by , meaning the value to predict. A feature row for time may use only indices strictly below . Anything touching or above leaks.
- Lags copy the past forward. Lag at time is . For daily sales, lag 1 is yesterday and lag 7 is the same weekday last week. Pick lags the autocorrelation supports, not every integer to 100.
- Rolling windows summarize a fixed lookback ending at . For window , the mean is . It captures momentum. The standard deviation over the same window captures volatility. The maximum captures recent peaks.
- Calendar codes name periodic position. Day of week from 0 to 6 and a weekend flag separate weekday from weekend demand. Because hour 23 sits next to hour 0, encode cycles on a circle with period : Event flags for holidays and promotions explain spikes no lag can anticipate.
Worked example
Five daily sales: , , , and for Monday to Friday. Build the row that predicts Friday, index 4 with true value .
Lag 1 is Thursday, . Lag 2 is Wednesday, . The 3-day rolling mean over Tuesday to Thursday is .
Friday is day of week with period . Its circle codes are and . The weekend flag is . That is the diagram: five dated dots flowing into one row holding , , , , , and .
Code
The point is the rule: every feature for Friday uses Thursday and earlier only, built with the standard library.
import math
sales: list[float] = [10.0, 12.0, 11.0, 13.0, 12.0]
lag_1: float = sales[3]lag_2: float = sales[2]print(f"{lag_1:.1f} {lag_2:.1f}") # -> 13.0 11.0
roll_mean: float = (sales[1] + sales[2] + sales[3]) / 3.0print(f"{roll_mean:.2f}") # -> 12.00
dow: int = 4print(f"{math.sin(2 * math.pi * dow / 7):.4f}") # -> -0.4339print(f"{math.cos(2 * math.pi * dow / 7):.4f}") # -> -0.9010Four prints, four agreements with the hand row. Shift the window to include Friday itself and the mean changes, which is exactly the leak the next section forbids.
Watch Out For
Averaging across the prediction point
A centered 3-day average for Thursday uses Wednesday, Thursday, and Friday. When that column predicts Friday, Friday is already inside it.
Symptom: backtest errors look excellent and live errors collapse, with the gap largest where rolling features dominate importance. Fix: shift first, then roll. Build every window from backward, never from , and validate the pipeline with cross-validation that fits transformers inside each fold.
Adding every lag to 100
Lags correlate with each other, so 100 lag columns carry a few real signals plus heavy duplication. Importance spreads thin, training slows, and overfitting grows.
Symptom: validation worsens as lags grow while training keeps improving, and lag importances flicker across folds. Fix: keep logical lags such as 1, 7, and 28 for daily data, summarize the gaps with rolling means, and let time-series decomposition guide which rhythm deserves a column.
The Quick Version
- Trees read rows as independent, so history must become columns before they can use it.
- Lag 1 and lag 2 copy Thursday at 13 and Wednesday at 11 into the Friday row.
- A 3-day rolling mean over Tuesday to Thursday gives momentum at 12.00 without touching Friday.
- Day of week 4 encodes as minus 0.4339 and minus 0.9010 on the weekly circle, with a weekend flag at 0.
- Every feature for time t uses indices below t only. Centered windows that include t leak.
- Keep a few logical lags plus summaries. Dozens of raw lags add collinearity, not signal.