Prophet Forecasting
Prophet fits curves to the calendar itself, so trend, weekly rhythm, yearly season and holidays simply stack into the forecast.
Why Does This Exist?
Classical models demand evenly spaced, complete series and a stationary signal, then ask a non-expert to tune , and . Business data laughs at all three demands: shops close on Sundays, sensors drop days, and growth bends whenever a product launches.
Prophet reframes forecasting as curve fitting on time itself. Time is the only regressor, so a missing Sunday is simply a date with no row, never a broken lag. Trend bends at learned changepoints, seasons ride Fourier waves, and holidays get their own bump, all added together.
This page teaches the additive stack and its fixture. For the lag-based classical alternative, read SARIMA. When calendar curves give way to learned memory, the sequel is LSTM forecasting, and its intervals lead to probabilistic forecasting.
Think of It Like This
Pricing a catering order from four stacked cards
A caterer prices a Saturday wedding with four cards. The base card says 100 plates for the headcount trend. The weekend card adds 12 for Saturday appetite. The December card adds 8 for holiday hunger. The wedding card adds 30 for the occasion itself. The total is 150, read straight off the stack.
The cards are trend, weekly seasonality, yearly seasonality and the holiday effect. The sum is the invoice. A Tuesday in March pulls plain cards and totals 90.
Where it stops: cards never argue with each other, while real trend and season interact, and the caterer knows weddings in advance whereas changepoints must be discovered from the data.
How It Actually Works
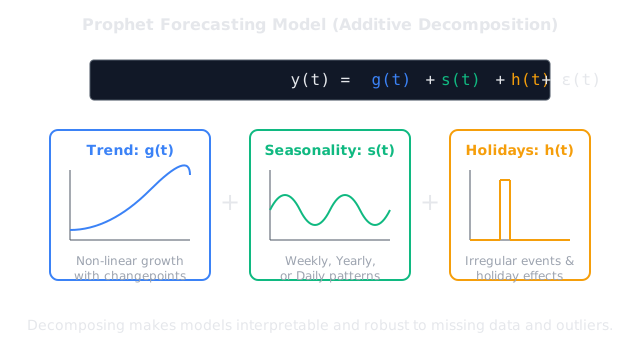
Call the trend , which means the slow non-periodic level. Call the seasonality , which means the calendar waves built from Fourier terms. Call the holiday bump , which means the extra effect learned per named date. The forecast is their sum plus noise:
The trend is piecewise linear or logistic with changepoints, which are dates where the growth rate shifts and the amber marker in the diagram sits. Seasonality uses a few sine and cosine pairs per period, so weekly rhythm needs few terms and yearly shape needs more. Holidays are indicator columns with wide windows, such as the shopping weekend around a single date.
Worked example
Price the Saturday holiday in the diagram. Trend , weekly , yearly , holiday . The forecast is . Now price a Tuesday in March with no holiday: trend , weekly , yearly , holiday , giving . Same four cards, different date, and the 60-unit gap between the two days comes entirely from the calendar stack.
Code
This additive stack replays both days with only the standard library:
def prophet_mean(trend: float, weekly: float, yearly: float, holiday: float) -> float: return trend + weekly + yearly + holiday
print(prophet_mean(100.0, 12.0, 8.0, 30.0)) # -> 150.0print(prophet_mean(100.0, -4.0, -6.0, 0.0)) # -> 90.0The two outputs match the hand totals: 150.0 for the stacked Saturday, 90.0 for the plain Tuesday. Drop the holiday term to zero and the Saturday falls to 120, showing how much one card can carry.
Watch Out For
Letting changepoints memorize one noisy month
The symptom is a trend line that jerks at every dip and a forecast tail that shoots off the chart. Too many changepoints turn a temporary slump into a permanent new slope. Plot the trend component alone: if it zigzags instead of bending a few times, lower the changepoint flexibility until only genuine regime shifts remain. One real launch bends the line, while noise only dents it.
Asking calendar curves to learn momentum
The symptom is a sensor or price series where yesterday predicts today far better than any Saturday effect, yet the model ignores yesterday entirely. Prophet never reads , so pure momentum systems slip through its curves. Check the lag-1 autocorrelation first: when it dominates, reach for an autoregressive model such as SARIMA instead of stacking more Fourier terms.
The Quick Version
- Prophet fits curves to time itself, so missing days are skipped rows rather than broken lags.
- The forecast stacks trend plus Fourier seasonality plus holiday effects, such as 100 plus 12 plus 8 plus 30 for 150.
- Changepoints let the trend bend at real regime shifts, while too many of them memorize noise.
- Fourier order sets wave flexibility: few terms for weekly rhythm, more for yearly shape.
- A Tuesday in March with no holiday totals 90 on the same stack that gives the Saturday 150.
- Momentum-driven series belong to autoregressive models, and learned memory belongs to LSTMs.