Vision Explainability Overview
Explanations answer which pixels the model used. Different methods answer at different resolutions, and the honest ones state their resolution upfront.
Why Does This Exist?
A classifier that says dog with 0.97 confidence could be reading the dog, the grass, or the watermark in the corner. Operators, auditors, and debuggers all need to know which, but no single heatmap serves all three: a coarse region map guides a human glance, while a pixel map debugs a spurious texture.
This page maps the vision attribution family and states what each rung assumes. Grad-CAM weights late feature maps for coarse regions. Saliency maps take input gradients for pixel detail. Integrated gradients average along a path to fix saturation. Attention rollout aggregates transformer layers. Concept-based explanations score human ideas instead of pixels. General background lives in model explainability.
Think of It Like This
A stadium usher describing a seat
Ask where your friend sits and the usher can point at the whole stand (coarse, always right), walk you to the row (medium effort, usually right), or read the exact seat number off a blurry ticket (precise, sometimes wrong). Each answer has a resolution and a failure mode.
Attribution methods are those three ushers. Grad-CAM points at the stand. Saliency reads the ticket. Integrated gradients re-reads it under better light. The analogy stops at faithfulness: ushers rarely lie, while heatmaps can look plausible and still misreport the model.
How It Actually Works
Residual only: the ladder and its prices. Grad-CAM pools class gradients over late channels and upsamples, so maps are coarse (a 7 by 7 grid stretched over the image) but stable. Saliency differentiates the score with respect to pixels, so maps are full resolution but noisy and saturate when confidence is extreme. Integrated gradients integrate along a baseline path with 20 to 50 steps, costing that many backward passes. Rollout multiplies layer attentions with residual mixing. Concept methods trade pixels for scores on labeled idea sets.
The numbers that order them
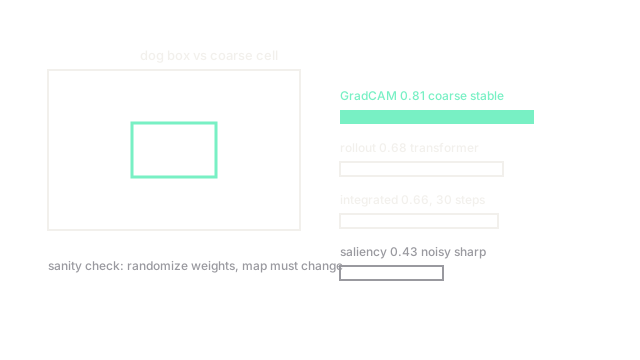
On one demo dog image with a drawn box: Grad-CAM overlap with the box is 0.81, saliency mass inside the box is 0.43, integrated gradients reach 0.66 at 30 steps (three times the cost of saliency), rollout puts 0.68 on the dog. Coarse wins for human triage; pathed methods win for debugging saturation. Every explanation claim therefore names its resolution and passes a sanity check (randomize weights, the map must change) or it is decoration.
Watch Out For
Presenting a plausible map as a faithful one
A smooth heatmap over the dog looks right even when the model used the background. The symptom is a beautiful figure with no sanity check. Randomize the late weights and re-run: if the map barely moves, it explains the image prior, not your model.
The Quick Version
- Explanations state which pixels mattered and at what resolution.
- Grad-CAM is coarse and stable; saliency is sharp and noisy; integrated gradients cost steps.
- Rollout aggregates transformer layers; concept methods score ideas, not pixels.
- On the demo image overlaps read 0.81, 0.43, 0.66, and 0.68 respectively.
- No sanity check means no explanation claim.