Image Histograms
A histogram counts how many pixels sit at each brightness level. Piles against the left edge mean underexposure, spikes at the edges mean detail clipped away forever.
Why Does This Exist?
Screens lie about exposure. A bright room makes every photo look dark, a dim room makes everything glow, and by the time you trust your eyes the shoot is over. The histogram does not care about your room: it counts pixels per brightness level and shows what the sensor actually captured.
Photographers read it to set exposure; vision engineers read it to sanity-check data. A dataset whose histograms all huddle left is underexposed everywhere, and no augmentation invents the clipped highlights back. This page covers reading the counts. Stretching them back out is contrast enhancement, built on exactly this tally.
Think of It Like This
Sorting election ballots into 256 piles
Dump every ballot from a precinct onto tables numbered to by shade of pen, one pile per number. A healthy election spreads across many piles. Every ballot crammed onto the first ten tables means the darker pens never showed up. A mountain on table means votes too bright to distinguish got lumped together.
The histogram is that count: pile height per brightness, with no record of which voter cast what.
The analogy stops here: ballots are choices, while pixel brightness is a measurement, so a "bad" histogram can be a correct photo of a dark cave.
How It Actually Works
For a single-channel image with levels to (usually ), the histogram is : the count of pixels with value exactly . The bins sum to the pixel count, . For color, compute one histogram per channel; a combined luminance histogram hides per-channel clipping, like a blown red sunset under a sane average.
Reading the shape: mass crowded left means underexposure, crowded right means overexposure, tall spikes exactly at or mean clipped detail that is gone, and wide gaps with unused middle bins mean low contrast wasting the available bit depth.
Worked example: a sixteen-pixel patch
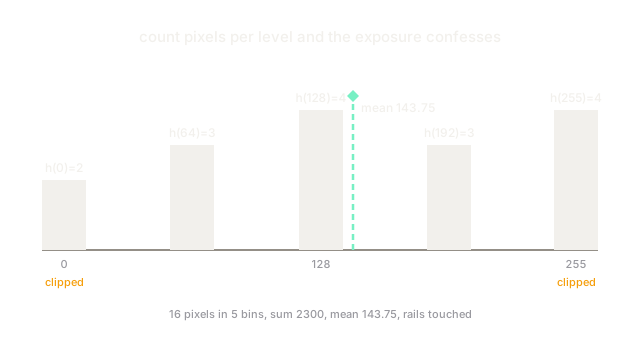
Take a grayscale patch with values . The nonzero bins are , , , , : sixteen pixels across five occupied bins. The mean brightness is , just above middle gray, with spikes at both ends warning that both shadows and highlights already touch the rails.
Code
from collections import Counter
patch = [0, 0, 64, 64, 64, 128, 128, 128, 128, 192, 192, 192, 255, 255, 255, 255]hist = dict(sorted(Counter(patch).items()))print(hist)print(sum(patch) / len(patch))# -> {0: 2, 64: 3, 128: 4, 192: 3, 255: 4}# -> 143.75Watch Out For
Equalizing a lopsided photo wrecks the subject
Global equalization stretches whatever dominates the tally. A portrait against a huge dark background remaps the background to gray and drags skin tones with it. Equalize adaptively in tiles, or mask the subject first, when the background owns most pixels.
One histogram per channel or miss the clipping
A sunset photo can clip red hard while its luminance histogram looks balanced, because green and blue dilute the spike. Always inspect , and tallies separately before declaring exposure healthy.
The Quick Version
- A histogram is the count of pixels at each brightness level, summing to the pixel total.
- Mass on the left means underexposure; spikes at 0 or 255 mean clipped detail is gone.
- Our sixteen-pixel patch spans five bins with mean brightness 143.75.
- Color needs one histogram per channel, since luminance averages hide single-channel clipping.
- Stretching the tally is contrast enhancement, but clipped bins hold nothing to stretch.