Uncertainty Estimation in Vision
A softmax score of 0.97 can be a guess. Uncertainty methods measure how much models disagree, so strange inputs route to humans before they cause harm.
Why Does This Exist?
A classifier outputs a full probability vector on every input, including inputs nothing like its training data: a sketch, a night shot, a new sensor. The top score still looks confident, because softmax must sum to 1. Acting on that confidence causes the worst failures, from wrong medical triage to phantom braking.
Uncertainty estimation separates what the model knows from what it guesses. Ensembles and dropout measure disagreement across predictions; calibration measures whether stated confidence matches accuracy; selective prediction routes the uncertain fraction to humans. Background on the two uncertainty kinds lives in aleatoric versus epistemic uncertainty.
Think of It Like This
Five radiologists voting independently
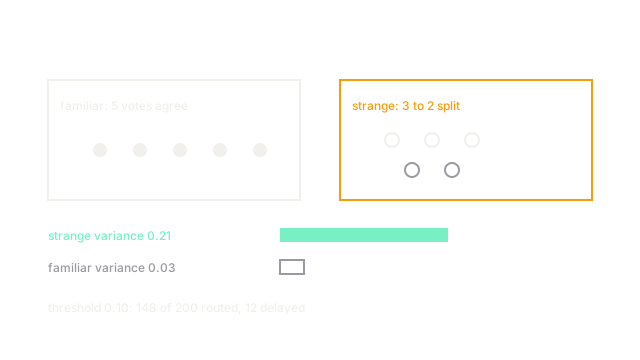
One radiologist always names something, even on a blurry scan. Five independent radiologists who agree 5 to 0 are trustworthy; a 3 to 2 split with hedged language means call the specialist. The vote spread, not any single vote, carries the doubt.
Ensembles are those five votes. Low variance means the models independently converged; high variance means the input sits where training gave no consensus. The analogy stops at cost: five radiologists bill five times, and so do five models, which is why cheaper approximations exist.
How It Actually Works
Train five models from different seeds, or run one dropout model twenty times (MC dropout). For each input, take the variance of the predicted probability for the top class. Familiar inputs give near-identical vectors and low variance; strange inputs scatter and variance spikes. Pick an abstention threshold on held-out data: above it, the system says unsure and routes to review instead of answering.
Worked example
A demo five-model ensemble scores 200 familiar photos and 200 corrupted ones. Mean variance on familiar inputs is 0.03; on corrupted inputs it is 0.21, a sevenfold gap. Setting the threshold at 0.10 routes 148 of 200 corrupted inputs to review while holding back only 12 of 200 familiar ones. Accuracy on the answered subset rises from 0.74 to 0.91. The cost is explicit: 12 good answers delayed to catch 148 bad ones.
Watch Out For
Tuning the threshold on the test set
A threshold picked to maximize answered accuracy on the evaluation set bakes in that set's corruption mix. The symptom is a deployed router that abstains constantly or never. Tune on a separate held-out split with a documented cost ratio for wrong answers versus delays.
The Quick Version
- Softmax confidence alone cannot mark strange inputs; disagreement can.
- Ensemble or dropout variance near 0.03 means familiar, near 0.21 means strange.
- A threshold at 0.10 routes most corrupted inputs to review at a small delay cost.
- Answered-subset accuracy rises because guesses are withheld, not because vision improved.
- Tune thresholds on held-out data with a stated cost ratio.