Exponential Smoothing
Tomorrow looks most like today and less like last month. Exponential smoothing blends all past sales with weights that fall geometrically.
Why Does This Exist?
A 30-day average treats a sale from 29 days ago exactly like yesterday sale. When a promotion ran yesterday, that equal weighting is wrong on purpose: yesterday tells you far more about tomorrow than last month does. A fixed window also forgets too sharply at its edge, dropping a useful old row all at once.
Exponential smoothing fixes the weighting. It keeps one running level, gives the newest observation a fixed share, and lets every older row fade geometrically. It needs one number for state rather than a full window, so it scales to thousands of series without storing long histories.
This page covers simple smoothing for level data without trend or seasonality. The persistence check that tells you smoothing can work lives in autocorrelation, and scoring the result out of sample belongs to evaluation metrics. The full forecaster with trend and seasonality is ARIMA, and the grouped version that must add up is hierarchical forecasting.
Basics first: smoothing assumes a roughly level series with stable variance. If trend or calendar seasonality dominates, smooth the residuals after removing them rather than the raw series.
Think of It Like This
A taxi driver reading recent traffic
A taxi driver guesses tonight travel time. The last 10 minutes of traffic count most, the last hour counts less, and yesterday barely whispers. One fresh jam moves the guess, while one old jam does not.
That maps directly: the guess is the level, the newest share is alpha at 0.4, and the whisper of old trips is the geometric tail that never fully reaches zero. A high alpha driver reacts fast and forgets quickly, while a low alpha driver moves slowly and trusts history.
Where it stops: the driver also knows weekends, holidays, and a steady growth in roadworks. Simple smoothing knows none of that. It tracks level only, so trend needs Holt and trend with season needs Holt-Winters.
How It Actually Works
Call the observation at time , meaning sales on day . Call the level after seeing , meaning the best guess of the underlying rate. Call the smoothing factor between 0 and 1, meaning the share of the vote the newest observation gets. Simple smoothing updates in one line:
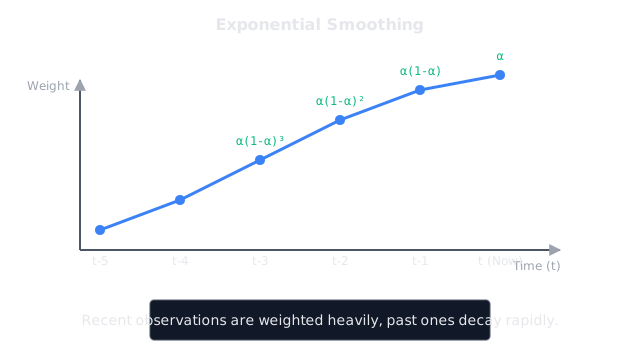
The forecast for the next step is the current level. Unrolled, the weights are on the newest row, next, then , and so on, with left on the starting level. They always sum to 1.0.
Worked example
Daily sales , , and . Start the level at the first sale, . Set .
Day one, :
Day two, :
Day three, :
The forecast for day four is . Unrolled, the weights are on , on , on , and on the starting , which sum to . That is the diagram: four sales bars beside three level steps ending at .
Holt adds a trend equation when the series climbs, and Holt-Winters adds a seasonal equation with a season length such as 12 for monthly data. Each extension keeps the same idea: new evidence takes a fixed share and old state keeps the rest.
Code
The point is the check: rebuild the three level steps by hand and confirm 20.80, 20.88, and 22.13.
alpha: float = 0.4level: float = 20.0
level = alpha * 22.0 + (1.0 - alpha) * levelprint(f"{level:.2f}") # -> 20.80
level = alpha * 21.0 + (1.0 - alpha) * levelprint(f"{level:.2f}") # -> 20.88
level = alpha * 24.0 + (1.0 - alpha) * levelprint(f"{level:.2f}") # -> 22.13The printout matches the hand steps. Change alpha to 0.9 and the same three lines jump faster toward each new sale. Change it to 0.1 and the level barely moves.
Watch Out For
Fitting level-only smoothing on trended data
A shop with steady growth fits simple smoothing and watches every forecast sit below the actuals, week after week.
Symptom: one-step errors stay positive on an upward slope instead of scattering around zero, and raising alpha only adds jagged chasing. Fix: move to Holt for trend or Holt-Winters for trend with season, and confirm the slope need on a level plot scored by evaluation metrics rather than by eye.
Picking alpha by feel instead of by error
An alpha of 0.8 looks responsive in a demo and then whipsaws on noisy days, while 0.1 looks smooth and then lags every turn.
Symptom: the choice changes with who looks at the chart, and no number justifies it. Fix: select alpha by minimizing out-of-sample squared error on proper splits from cross-validation, and report the chosen value with the horizon it was tuned for.
The Quick Version
- Simple smoothing forecasts tomorrow with the current level, which is alpha times today sale plus one minus alpha times yesterday level.
- Sales of 20, 22, 21, and 24 with alpha 0.4 give levels 20.80, then 20.88, then 22.13, so the next forecast is 22.13.
- The weights fall geometrically: 0.40 on the newest sale, then 0.24, 0.144, and 0.216, summing to 1.0.
- High alpha reacts fast and forgets quickly, while low alpha moves slowly and trusts history.
- Simple smoothing tracks level only. Trend needs Holt, and trend with season needs Holt-Winters.
- Tune alpha on walk-forward error, never by how smooth the line looks.