Hierarchical Forecasting
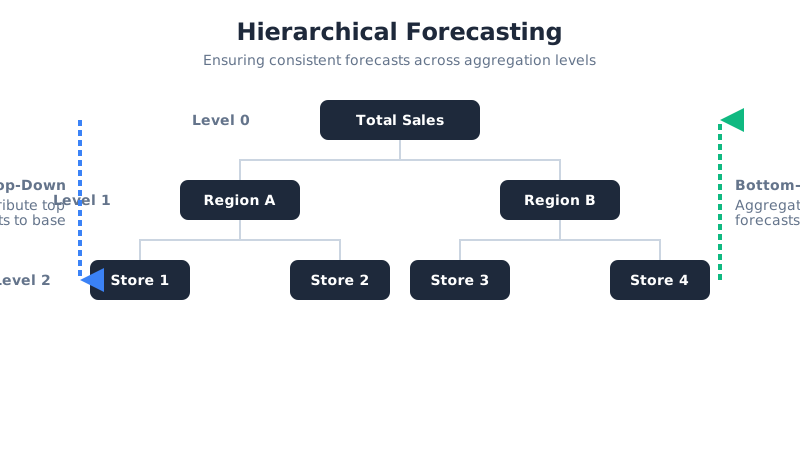
Store forecasts must add to region forecasts and regions to the country. Reconciliation enforces the sums while borrowing strength across levels.
Why Does This Exist?
A retailer forecasts each store, each region, and the national total. Fit separately and the parts refuse to add up: two regions at 450 and 600 sum to 1050 while the national model says 1000. Finance cannot plan stock from numbers that disagree with themselves, and no meeting should relitigate which level to believe.
Hierarchical forecasting enforces coherence: every child sum equals its parent exactly. It also improves accuracy, because aggregates are smooth and easy to forecast while base series carry detail with noise. Combining both beats trusting either alone.
This page covers the reconciliation step after base forecasts exist. Building the base forecasts from history belongs to feature engineering. Scoring the coherent result belongs to evaluation metrics. Splitting trend from season inside each series belongs to time-series decomposition.
Basics first: a hierarchy is a fixed aggregation tree, such as stores into regions into the country. Coherence means each parent equals the sum of its children, with no rounding gaps.
Think of It Like This
Slicing one pizza two ways
A whole pizza is the national total. Two slices are the regions.
Top-down orders the whole pizza first, then cuts by past shares: 40 percent and 60 percent of a 1000-gram pizza give 400 and 600 grams. The slices always rebuild the whole because they were cut from it.
Bottom-up bakes the slices first at 450 and 600 grams, then pushes them together and calls the whole 1050 grams. The sum holds by construction, and local flavor survives, but two burnt slices spoil the total.
Where it stops: pizza shares stay fixed once cut, while real region shares drift as markets grow at different speeds. Fixed historical proportions go stale, which is why modern reconciliation adjusts every level instead of freezing one.
How It Actually Works
Call the base forecasts the independent numbers before reconciliation, meaning they need not add up. Call the coherent forecasts the adjusted numbers after, meaning each parent equals its children sum. Reconciliation maps the first set to the second.
- Bottom-up keeps the base level and sums upward. Regions stay 450 and 600, and the total becomes . It preserves local detail and needs no shares, but aggregates base noise.
- Top-down keeps the top level and splits downward by historical proportions. With shares and and a top forecast of , regions become and . It stays stable when base data is sparse, but ignores fresh local trends.
- Middle-out starts at an intermediate level, sums upward, and splits downward. It suits a level with the cleanest signal, such as regions when stores are too noisy and the total hides mix shifts.
- Optimal reconciliation adjusts every level at once under the summation constraints, minimizing total variance. MinT weights each base forecast by its estimated accuracy, so reliable levels move little and noisy levels move more.
Worked example
Hierarchy: total with children Region A and Region B. Independent base forecasts: total , Region A , Region B . The children sum to , which disagrees with by . The set is incoherent.
Bottom-up reconciliation keeps and and sets the total to . Every parent now equals its children, and the gap is resolved by moving the total.
Top-down reconciliation keeps and applies historical shares and . Region A becomes and Region B becomes . The children now sum to , and the gap is resolved by moving the regions. That is the diagram: one tree with the incoherent triple beside two coherent triples, each summing exactly.
Code
The point is the arithmetic: same incoherent triple, two coherent answers from opposite ends.
total: float = 1000.0reg_a: float = 450.0reg_b: float = 600.0
bu_total: float = reg_a + reg_bprint(f"{bu_total:.0f}") # -> 1050
share_a: float = 0.4share_b: float = 0.6td_a: float = total * share_atd_b: float = total * share_bprint(f"{td_a:.0f} {td_b:.0f}") # -> 400 600print(f"{td_a + td_b:.0f}") # -> 1000Three prints, two coherent hierarchies. Bottom-up moves the total to 1050, top-down moves the regions to 400 and 600, and each tree now adds up.
Watch Out For
Bottom-up on sparse noisy base rows
A SKU at one store sells zero most days with occasional ones. Bottom-up treats those ones as signal and sums the noise upward.
Symptom: coherent totals swing wildly while the top-down total stays smooth, and base-level intervals are wider than the means. Fix: reconcile from a cleaner middle level or use optimal weighting, and build base forecasts with count-aware features from feature engineering rather than raw sums.
Top-down shares frozen while regions drift
Region A grows twice as fast as Region B, but the split still uses last year 40 and 60 shares. The growing region starves while the shrinking one overflows.
Symptom: coherent errors skew by region with opposite signs that persist across folds, even as total error looks fine. Fix: update shares on recent windows, test share stability on splits from cross-validation, and move to optimal reconciliation when drift is confirmed.
The Quick Version
- Coherence means each parent forecast equals the sum of its children exactly.
- Base forecasts of 1000 total with regions 450 and 600 sum to 1050, so the set starts incoherent by 50.
- Bottom-up keeps 450 and 600 and moves the total to 1050, preserving local detail with noise.
- Top-down keeps 1000 and splits by 0.40 and 0.60 into 400 and 600, gaining stability while ignoring local shifts.
- Middle-out reconciles from the cleanest intermediate level in both directions.
- Optimal MinT adjusts every level at once to minimize variance under the summation constraints.
- Score coherent forecasts with the same metrics as any forecast, in evaluation metrics.