Matplotlib for Image Display
Matplotlib turns arrays back into pictures you can look at: one call shows the image, but the array range and channel order decide what you see.
Why Does This Exist?
Arrays are not pictures until something maps numbers to light. Print a photo array and you get a wall of digits; show it and you see the scene, the bug, or the reason the model fails. Matplotlib's imshow is that mapping for quick inspection: one call renders an array inside a figure you can compare, zoom, and save.
The mapping has rules, and silent ones. Float arrays must sit in 0.0 to 1.0, byte arrays in 0 to 255, and three channels read as red, green, blue. Break a rule and the picture lies without warning. This page covers showing images and comparing them side by side. Turning arrays into normalized inputs belongs to NumPy; counting pixel values belongs to image histograms.
Think of It Like This
A projector with a fixed brightness dial
A slide projector maps each slide's dye density to brightness on screen, and its dial has a fixed range. Slides made for that range glow correctly. Slides made for a far wider range blast every bright region to pure white, because the projector clips what exceeds its dial.
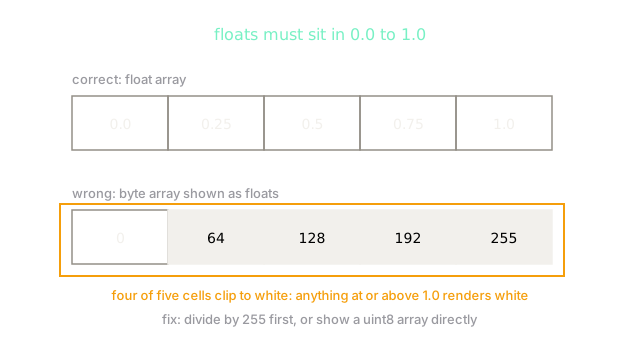
imshow is the projector, and the array's range is the slide. Floats in 0.0 to 1.0 fit the dial. Bytes 0 to 255 shown as floats overflow it, so everything from 64 up renders white. The analogy stops at the fix: no knob rescues a mismatched array, you rescale the numbers first.
How It Actually Works
imshow takes an grayscale or color array and paints each element as one screen pixel. For floats it maps 0.0 to black and 1.0 to white, clipping anything outside. For uint8 it maps 0 to black and 255 to white. Three channels display as red, green, blue in that order, which is why arrays from libraries that store blue first need their last axis reversed before showing. Subplots place several such paintings on one figure: original beside processed, prediction beside truth, each with its own axes.
The five-cell check
Read the diagram as a rule with numbers. Correct input, five floats:
- 0.0 renders black, 0.25 dark gray, 0.5 mid gray, 0.75 light gray, 1.0 white.
Wrong input, five bytes shown as floats:
- 0 renders black, while 64, 128, 192 and 255 sit at or above 1.0 and all four clip to white.
Four of five cells lie. The fix is one division by 255 before the call, or passing the uint8 array unchanged so the byte rule applies. Either way the numbers decide, never the call.
Code
Check the array before you show it. These three prints catch both failure modes:
import numpy as np
img = np.array([[0, 128, 255], [64, 192, 32]], dtype=np.uint8)print(img.shape, img.dtype, int(img.min()), int(img.max())) # -> (2, 3) uint8 0 255print((img.astype(float) / 255.0).round(3)[0]) # -> [0. 0.502 1. ]Shape first: two rows, three columns, single channel, so imshow paints gray. Range second: bytes spanning the full 0 to 255, so either show as uint8 or divide first. The 0.502 repeats the normalization arithmetic, which is the point: display and model input want the same scaling.
Watch Out For
Showing byte values as floats and seeing snow
The symptom is a nearly white figure with a few dark dots, on an array you know holds a real scene. The cause is dtype blindness: bytes 0 to 255 displayed under float rules, so every value from 1 up clips to white and only exact zeros stay dark.
Fix it by matching rule to array. Divide floats into 0.0 to 1.0, or hand imshow the uint8 array directly. Print dtype and range before the call until it becomes reflex.
Displaying blue-first arrays as red-green-blue
Arrays loaded by OpenCV store blue first, while imshow reads red first. The symptom is a rust-orange scene rendered ocean blue, with histograms and statistics all perfectly correct. Everything numeric passes; only the picture lies.
Fix it by reversing the last axis before showing. Suspect channel order whenever colors look chemically wrong but the numbers look fine.
The Quick Version
imshowmaps floats 0.0 to black and 1.0 to white, clipping anything outside that range.- Bytes 64 to 255 shown as floats all clip to white, so divide by 255 or show the
uint8array. - Three channels display as red, green, blue; blue-first arrays need their last axis reversed.
- Subplots compare scenes side by side: original against processed, prediction against truth.
- Print shape, dtype and range before showing; the numbers decide which rule applies.
- Histograms count what the eye misses, so pair every display with one when tuning matters.